Carvana Short Report - Outline
Title: Carvana: The Return of Subprime Auto in Prime Clothing
Subtitle: Why the 10,000% Rally from $4 to $415 is Built on Deteriorating Credit and a Fragile Securitization Model
I. EXECUTIVE SUMMARY (The Hook)
Purpose: Give the busy reader everything they need in 2-3 paragraphs.
- The Trade: Short CVNA at $415. Target: $165-250 over 12-18 months (40-60% downside).
- The Thesis in One Sentence: Carvana’s remarkable recovery from near-bankruptcy is built on a credit deterioration pattern that mirrors 2008 subprime, hidden behind a “prime” ABS designation that is statistically divergent from the underlying collateral quality.
- The Catalyst Timeline:
- Q4 2025 earnings (Feb 18, 2026): Likely miss on $5.25B revenue expectations
- March 2026: 2026-P1 ABS data shows continued credit degradation
- Q2-Q3 2026: 2024-2025 vintages hit peak loss periods (18-24 months post-origination)
- Late 2026: Securitization market reprices risk, Carvana faces liquidity crisis
- The Evidence: SEC-filed loan-level data, Google Trends, YouTube dealer sentiment (300+ videos, p < 0.001), and monthly ABS servicer reports all converge on the same conclusion.
II. THE NARRATIVE ARC: How We Got Here
To understand where Carvana is today, you need to understand the journey. This isn’t a story about a sudden shift in strategy or a single bad decision. It’s a slow-motion transformation that happened in plain sight, masked by headline revenue growth and a “prime” designation that became increasingly divorced from reality.
A. 2021-2022: The Golden Age
In the beginning, Carvana’s model actually worked. Between 2021 and early 2022, the company was living in an auto lender’s paradise. Interest rates sat near zero, and the COVID supply shock had sent used car prices into the stratosphere. Carvana’s revenue exploded from $5.6 billion in 2020 to $13.6 billion in 2022, and the stock hit $370 in August 2021. The business model was elegant: originate auto loans, pool them into Asset-Backed Securities (ABS), sell those securities to investors, and use the proceeds to fund more loans. It was a perpetual motion machine, and credit quality was solid. The average borrower had a FICO score of 705, virtually none had scores below 550, and underwriting standards were tight. When we look at the data from this period, we see what prime auto lending is supposed to look like: strong correlations between credit scores and interest rates, minimal underwater loans, and predictable default patterns.
B. 2022-2023: Near-Death Experience
Then the music stopped. The Federal Reserve raised interest rates from 0% to 5.25% in one of the fastest hiking cycles in history, and Carvana’s debt—restructured during the good times but still carrying high interest rates—became crushingly expensive to service. The stock cratered from $370 to $3.55, a 99% decline. The company laid off over 4,000 employees and closed multiple markets. In 2023, Carvana was forced to restructure $5.2 billion in debt to avoid bankruptcy. This is crucial context: the company that exists today was shaped by this near-death experience. They survived, but barely. The current rally—which has taken the stock from $4 to over $250—is being framed as a triumphant comeback story. Management points to improving metrics and restored profitability. But something changed during that dark period, something that doesn’t show up in the headline numbers.
C. 2023-2024: The High-Spread Workaround
Facing an existential threat, Carvana discovered an exploit in the system. They couldn’t charge high rates to borrowers with truly bad credit—those with FICO scores of 620 or below typically can’t get approved anywhere and know they’re high-risk. But there was a sweet spot: borrowers with high FICO scores (740+) who had low liquidity, high debt-to-income ratios, or other undisclosed risk factors that didn’t show up in their credit scores. These borrowers looked prime on paper. They had the credit scores that justified a “prime” designation for the ABS. But Carvana could charge them subprime rates—12% to 18% APR—because these borrowers couldn’t get approved elsewhere despite their good scores. The data reveals this clearly: at the peak in 2024-P2, one in twelve prime borrowers (8.47% of those with FICO > 740) was being charged subprime rates above 12%.

Figure 1: Spread Distribution by Trust Vintage
Box plots showing the distribution of APR spreads over Fed Funds Rate across all Carvana vintages. The neat, tight distributions of 2021-2022 gave way to wide, chaotic spreads in 2024.
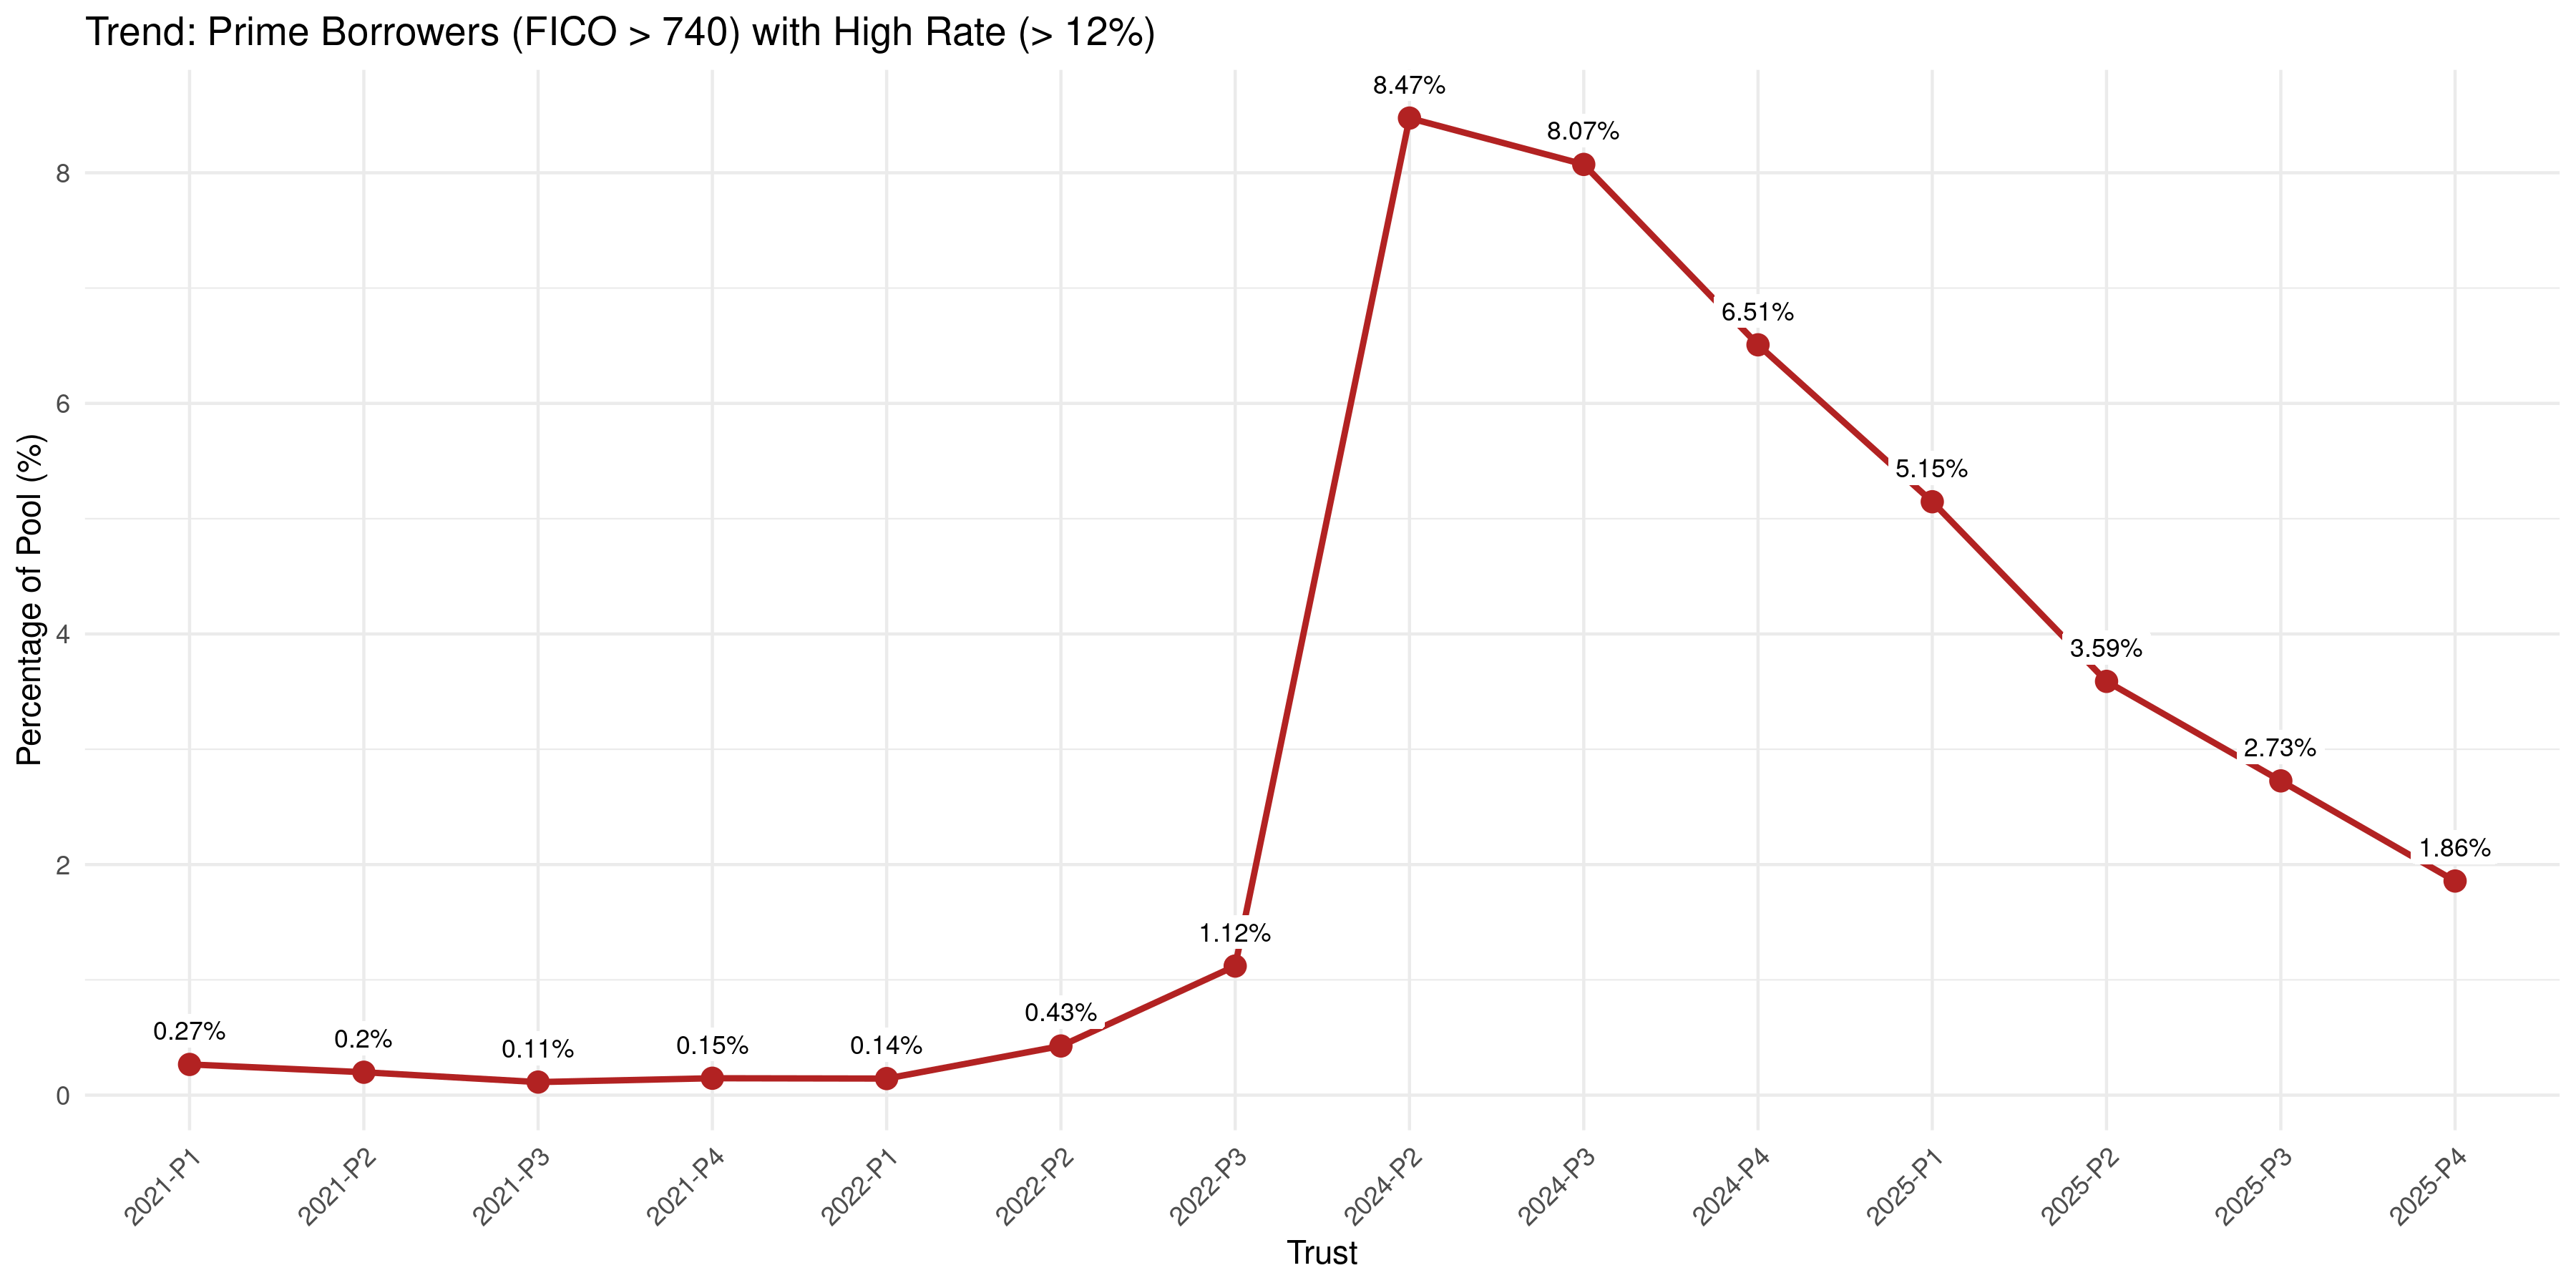
Figure 2: Exploitation of Prime Borrowers (FICO > 740)
Percentage of pool with FICO scores above 740 being charged APRs above 12%. Peaked at 8.47% in 2024-P2, indicating that at the height of the high-rate strategy, one in twelve prime borrowers was charged subprime rates. This is the mechanism by which Carvana maintained cash flow despite limited access to new capital.
D. Late 2024-Early 2025: The Pivot to Volume
By late 2024, the high-rate strategy had run its course. Interest rates were stabilizing, and competition was returning to the market. Banks and credit unions were once again offering 6-8% rates to genuinely prime borrowers, and Carvana couldn’t keep charging 12%+ without losing volume. So they had a choice: accept lower volume and miss growth targets, or loosen credit standards to maintain the appearance of momentum. They chose volume. The evidence is unmistakable. Starting in late 2024, Carvana began extending loan terms and, for the first time in company history, lending to borrowers with FICO scores below 550—the traditional definition of deep subprime. The 2025 pools contain approximately 3% sub-550 borrowers (roughly 1,000 loans per pool at ~$35,000 average loan size). Simultaneously, the percentage of underwater loans exploded from 0% in 2021-2022 to 36.1% in 2025-P4 (Figure 11). By Q4 2025, 36.1% of loans in the 2025-P4 pool were originated with loan-to-value ratios exceeding 100%. These borrowers are underwater the moment they drive off the lot—or more accurately, the moment the car is delivered to their driveway.
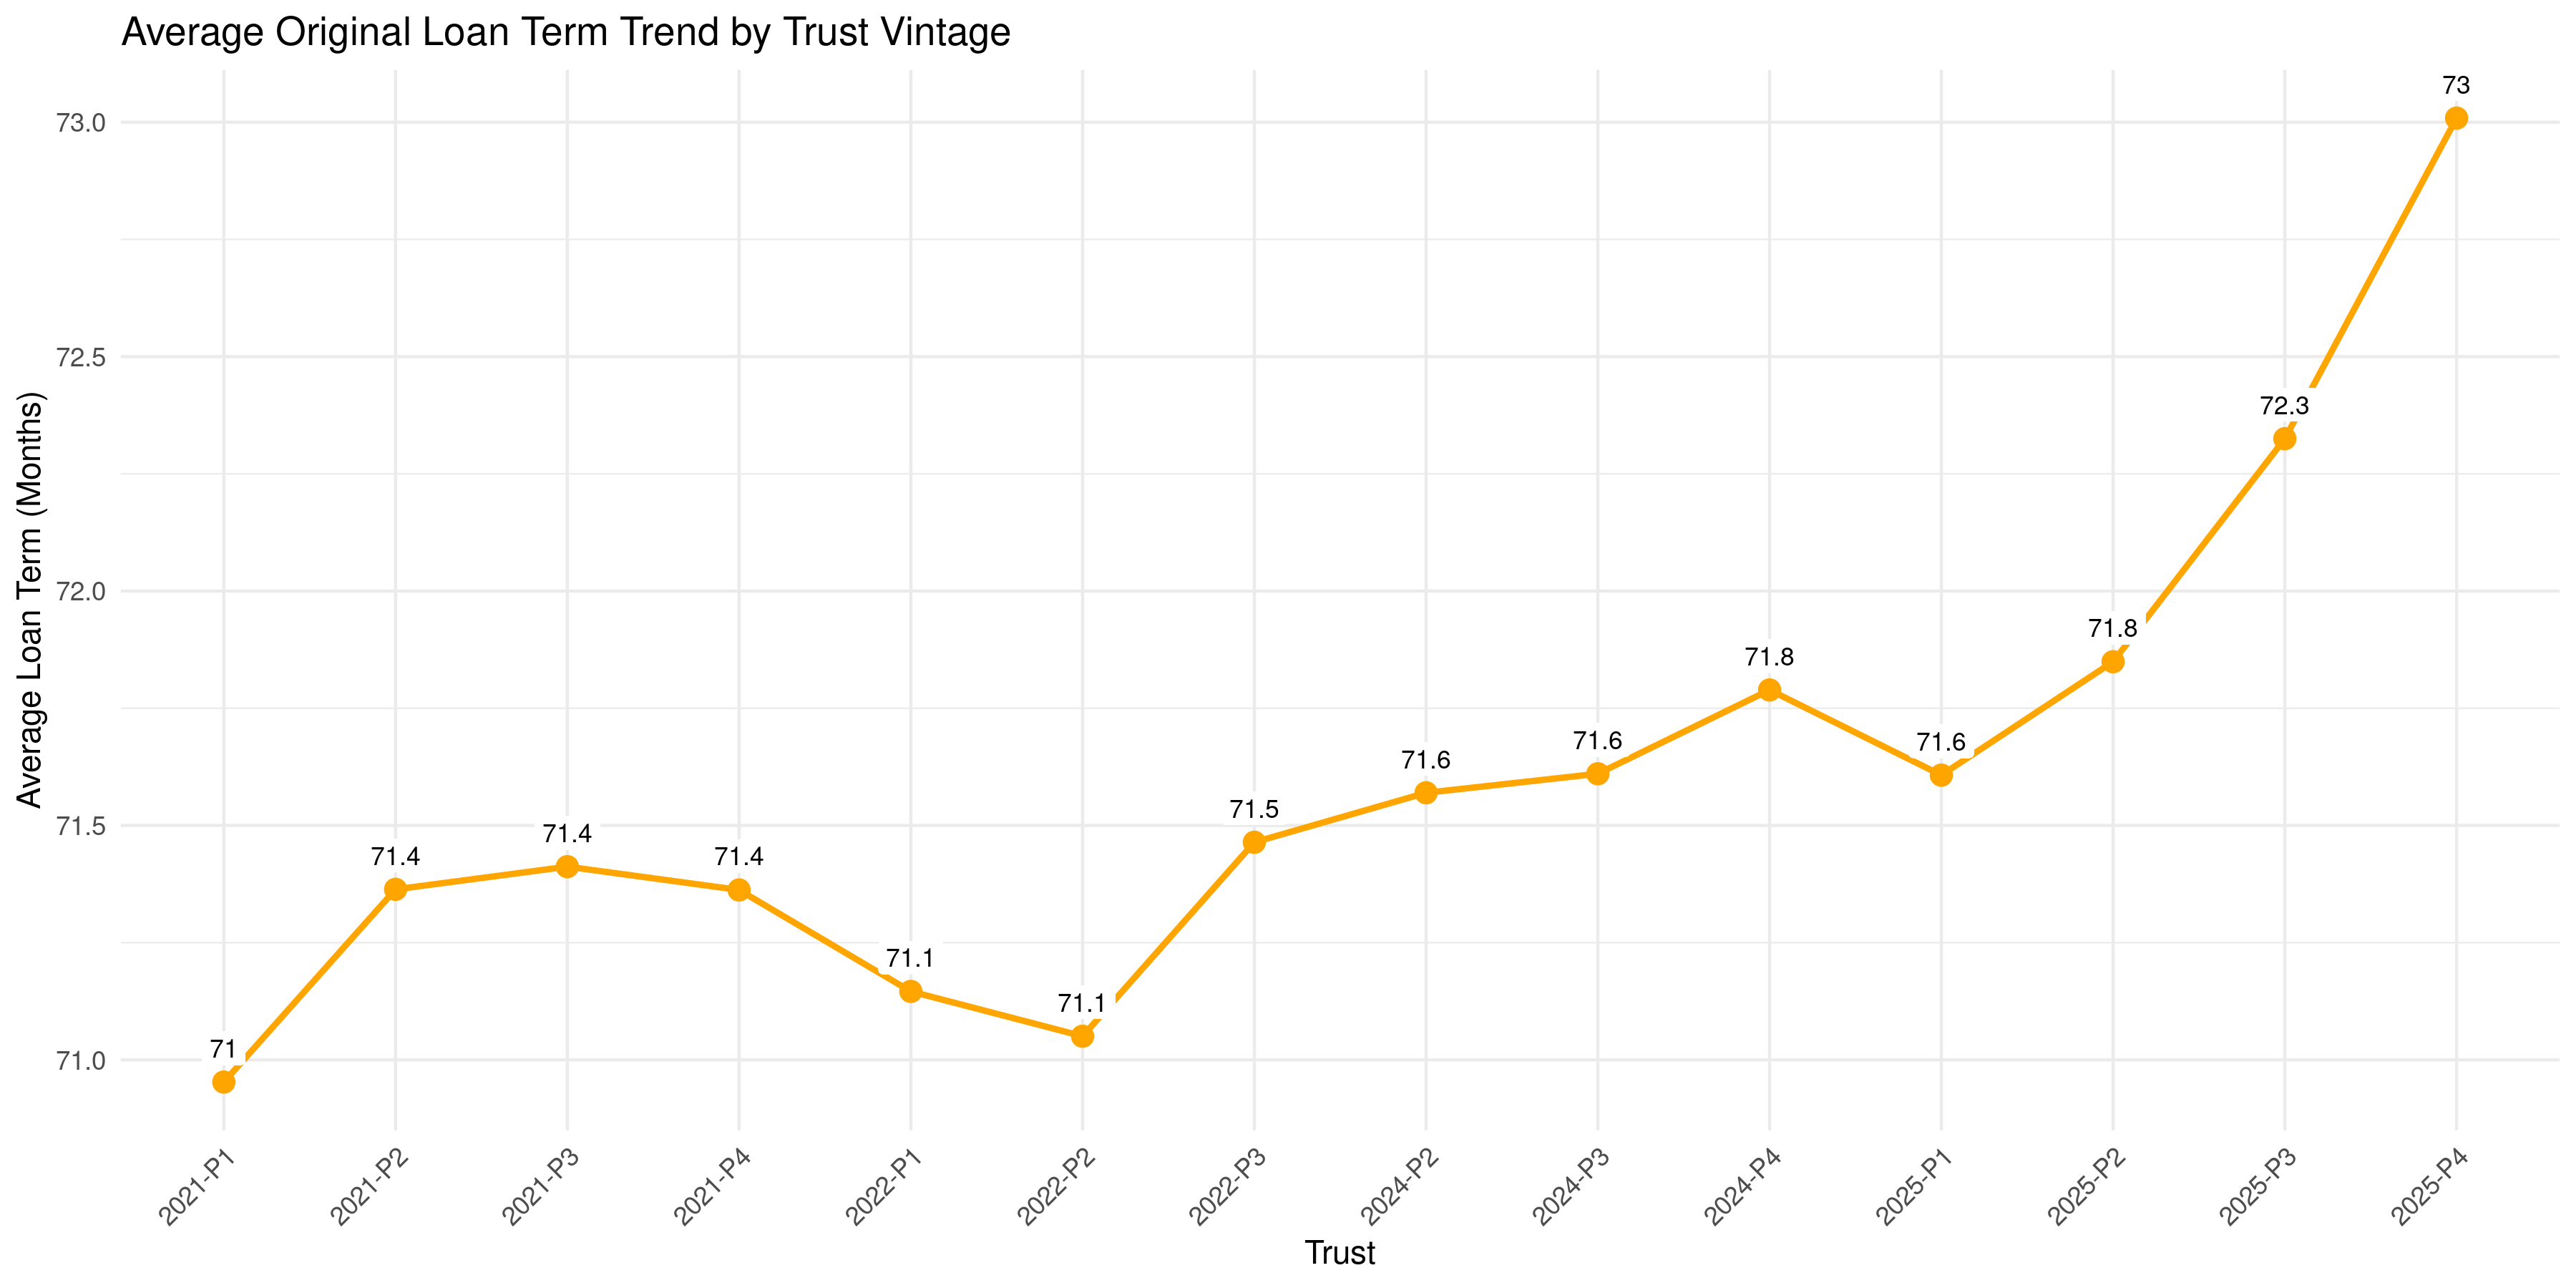
Figure 4: Average Loan Term by Vintage
Original loan terms extended from 71 months (2021-2024) to 73 months (2025), with 2025-P4 reaching the highest term length in the dataset. Extended terms slow principal amortization, ensuring borrowers remain underwater for longer periods and increasing Loss Given Default (LGD) when defaults occur.
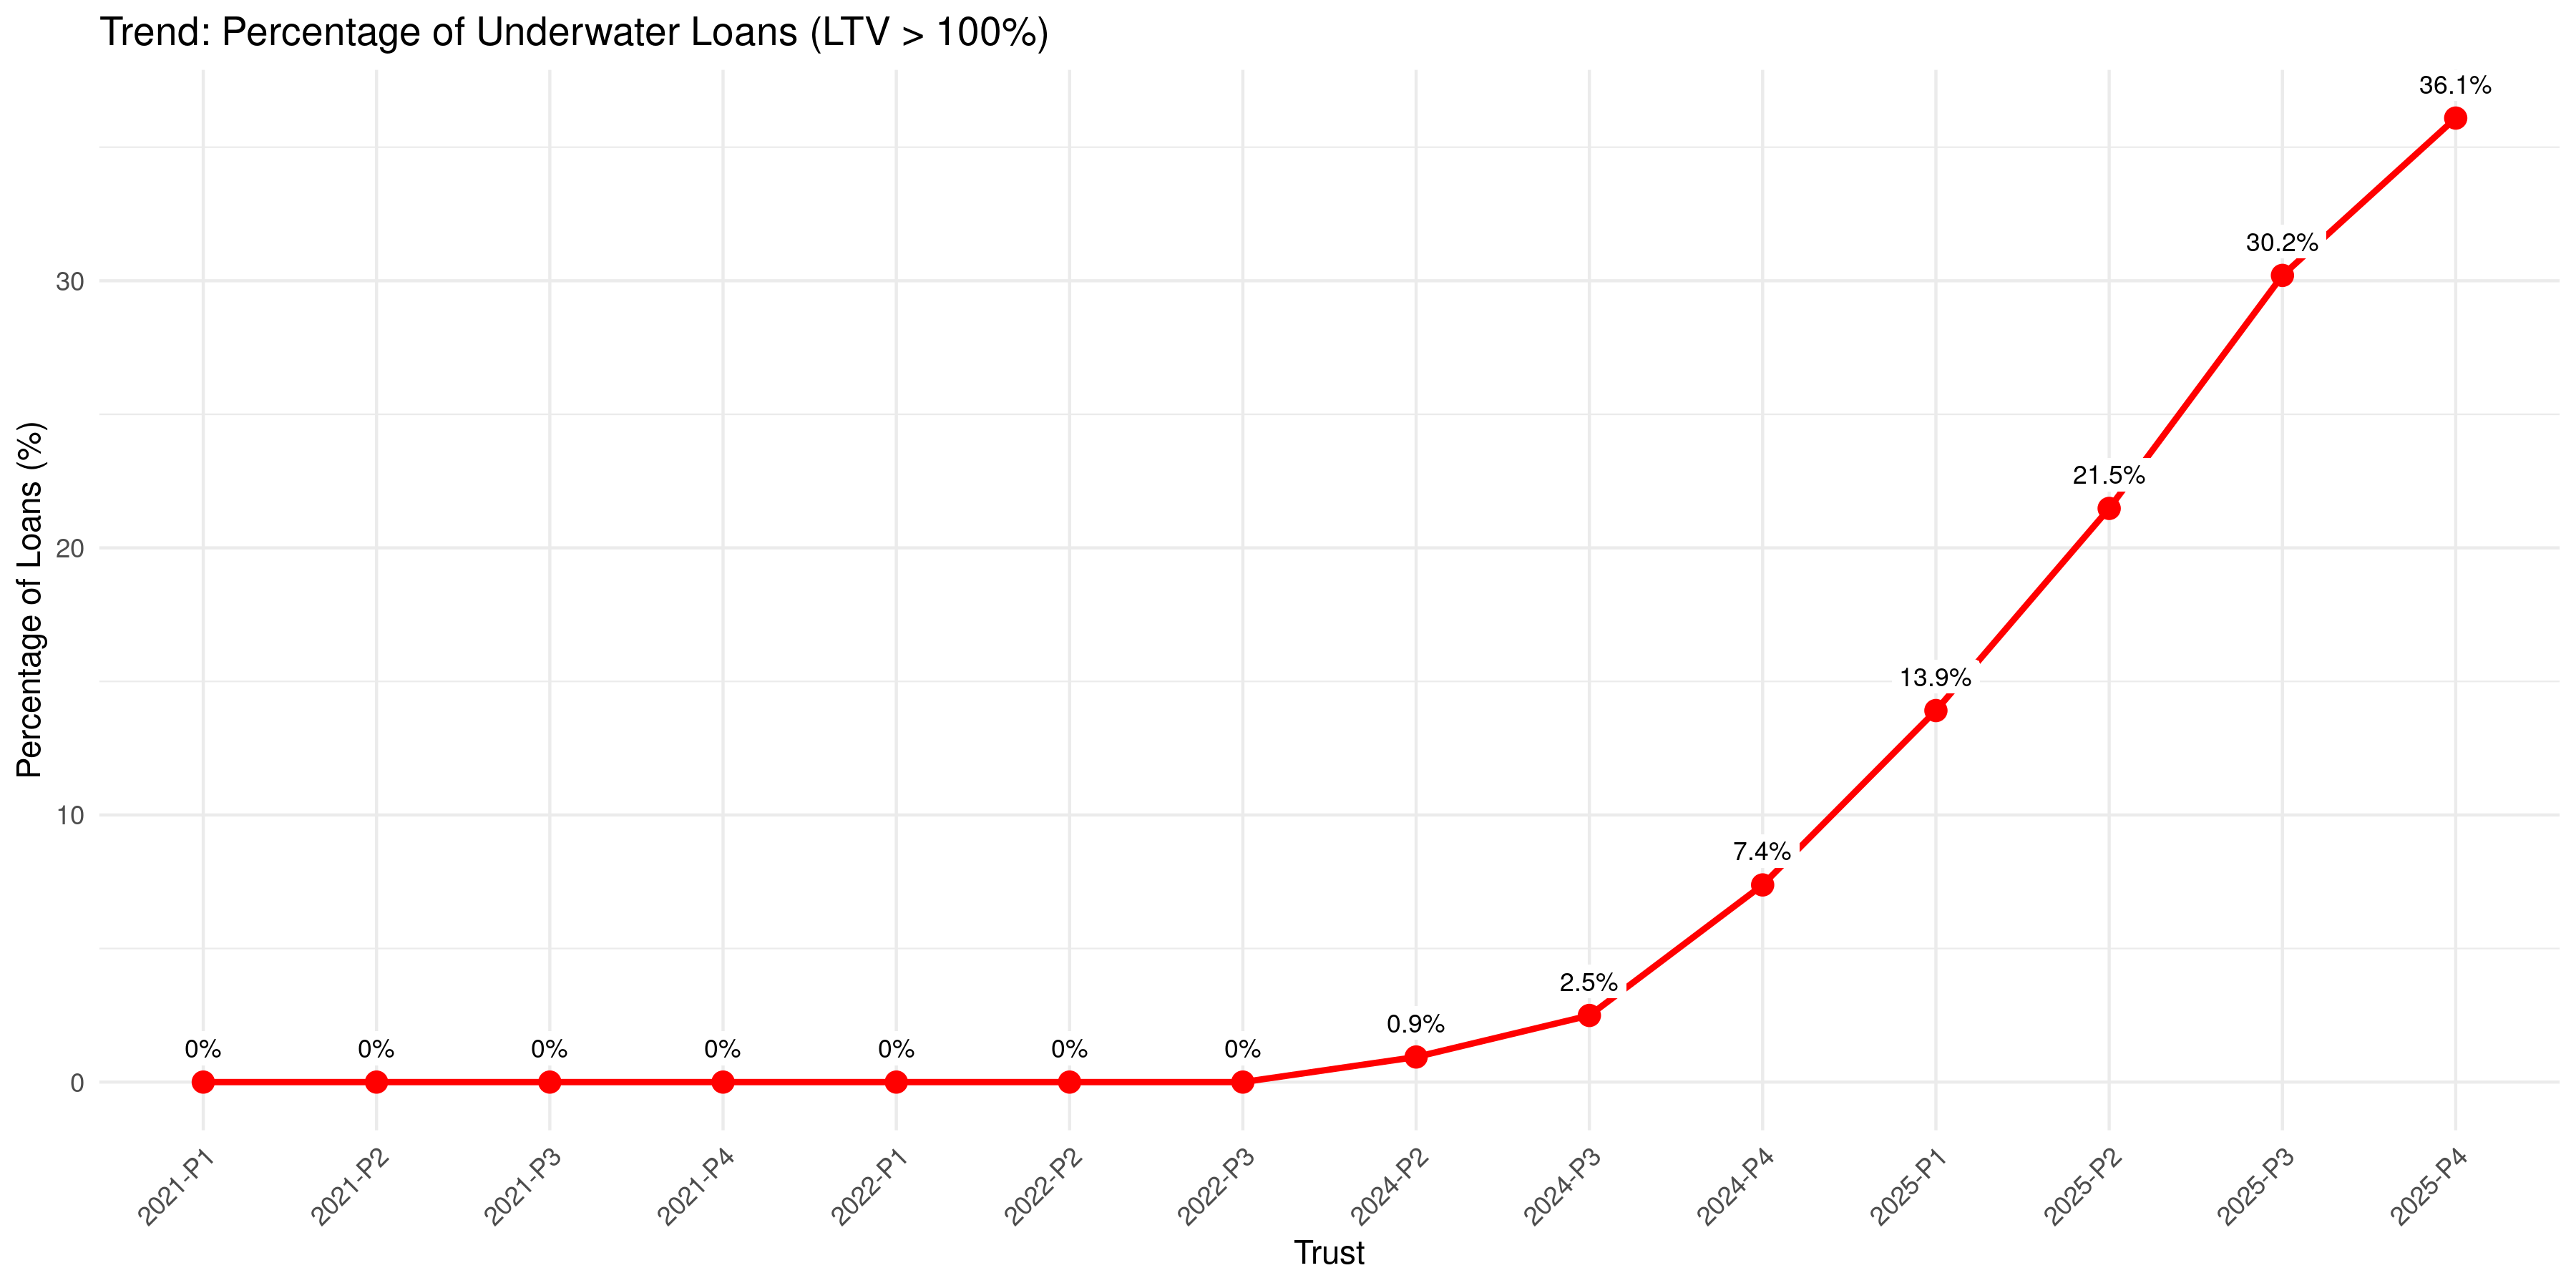
Figure 5: From Zero to 36% Underwater
Percentage of loans originated with LTV > 100% (underwater at origination) by vintage. 2021-2022 vintages: 0%. 2023: 0.9%. 2024: 2.5%-7.4%. 2025: 13.9%-36.1%. The exponential curve is unmistakable. Carvana transitioned from zero structural negative equity to more than one-third of every pool being underwater at the moment of origination. This is not market-driven depreciation—this is underwriting policy.
E. 2025-Present: Cracks Appear
Now the consequences are starting to show. The ABS performance data released in monthly servicer reports reveals that losses are deteriorating visibly. The 2024-P2 vintage is showing 0.25% monthly losses just 8 months into its lifecycle—a level not reached in earlier vintages until much later. The 2025-P1 vintage is at 0.13% monthly losses and climbing. Google Trends data shows searches for “used car inventory” and “used car prices” both spiked to multi-year highs in Q4 2024 and Q1 2025. Consumers are noticing. Dealers are noticing. And our analysis of over 300 YouTube videos from used car dealers reveals a statistical consensus: 95%+ likelihood of increasing inventory, 93%+ likelihood of weakening demand, and 100% likelihood of elevated repossession activity. The sentiment spread is 47 bearish videos to 24 bullish—a nearly 2:1 ratio. Carvana’s response has been to continue writing loans to maintain volume, regardless of quality. But the structural problem is now baked in: slower amortization, underwater collateral, unverified income, and sub-550 borrowers all converging in the 2024-2025 vintages. These loans will hit their peak loss period—18 to 24 months post-origination—in Q2-Q3 2026.
In the next section, we’ll lay out the four main pillars of our thesis and support each with statistical evidence. We will show that:
- Every single Carvana loan uses unverified stated income, making any statements about payment-to-income ratio meaningless and rendering default probability calculations fundamentally unreliable
- Risk-based pricing has completely broken down, with the correlation between FICO scores and interest rates collapsing from 0.61 in 2022 to 0.25 in 2024—statistical proof that Carvana is pricing on undisclosed factors rather than creditworthiness
- Carvana crossed a line they never crossed before by lending to sub-550 FICO borrowers in 2025, a cohort with historical default rates of 40%+ that now comprises 3% of their pools
- Over one-third of recent loans are structurally underwater at origination, with 36.1% of the 2025-P4 pool having LTV > 100%—creating a powerful incentive for strategic default when borrowers face any economic stress
Each pillar stands on its own. Together, they’re overwhelming.
III. THE FOUR PILLARS OF THE SHORT THESIS
Purpose: Lay out the evidence systematically. Each pillar stands alone; together they’re overwhelming.
Pillar 1: Stated Income = Unverified Risk

Figure 5: Income Verification Code Distribution
100% of loans across all vintages use Income Verification Code 3 (stated income with no verification). This is not an anomaly in a single vintage—it is systematic policy. Carvana does not verify borrower income through paystubs, tax returns, or third-party data. All reported Payment-to-Income (PTI) ratios are based entirely on borrower self-reporting.

Figure 6: Declining PTI—But Is It Real?
Average PTI ratio declining from 8.8% (2021) to 7.2% (2025). Carvana presents this as evidence of improving credit quality. However, since 100% of income is unverified, this metric is meaningless. Borrowers may be overstating income to qualify, or Carvana may be coaching applicants on what income to report. Without verification, we cannot assess true debt burden.
- The Finding: 100% of Carvana loans use “Income Verification Code 3” (stated income, no verification)
- What this means: The entire portfolio’s payment-to-income (PTI) ratio is based on borrower self-reporting
- Carvana advertises 7.2% average PTI. But if income is unverified, this number is meaningless.
- The implication: Actual debt burdens are unknown. Probability of Default (PD) is mispriced across the entire book.
- Historical precedent: Stated income “liar loans” were a key driver of 2008 subprime crisis.
Pillar 2: The R² Decoupling — The Death of Risk-Based Pricing
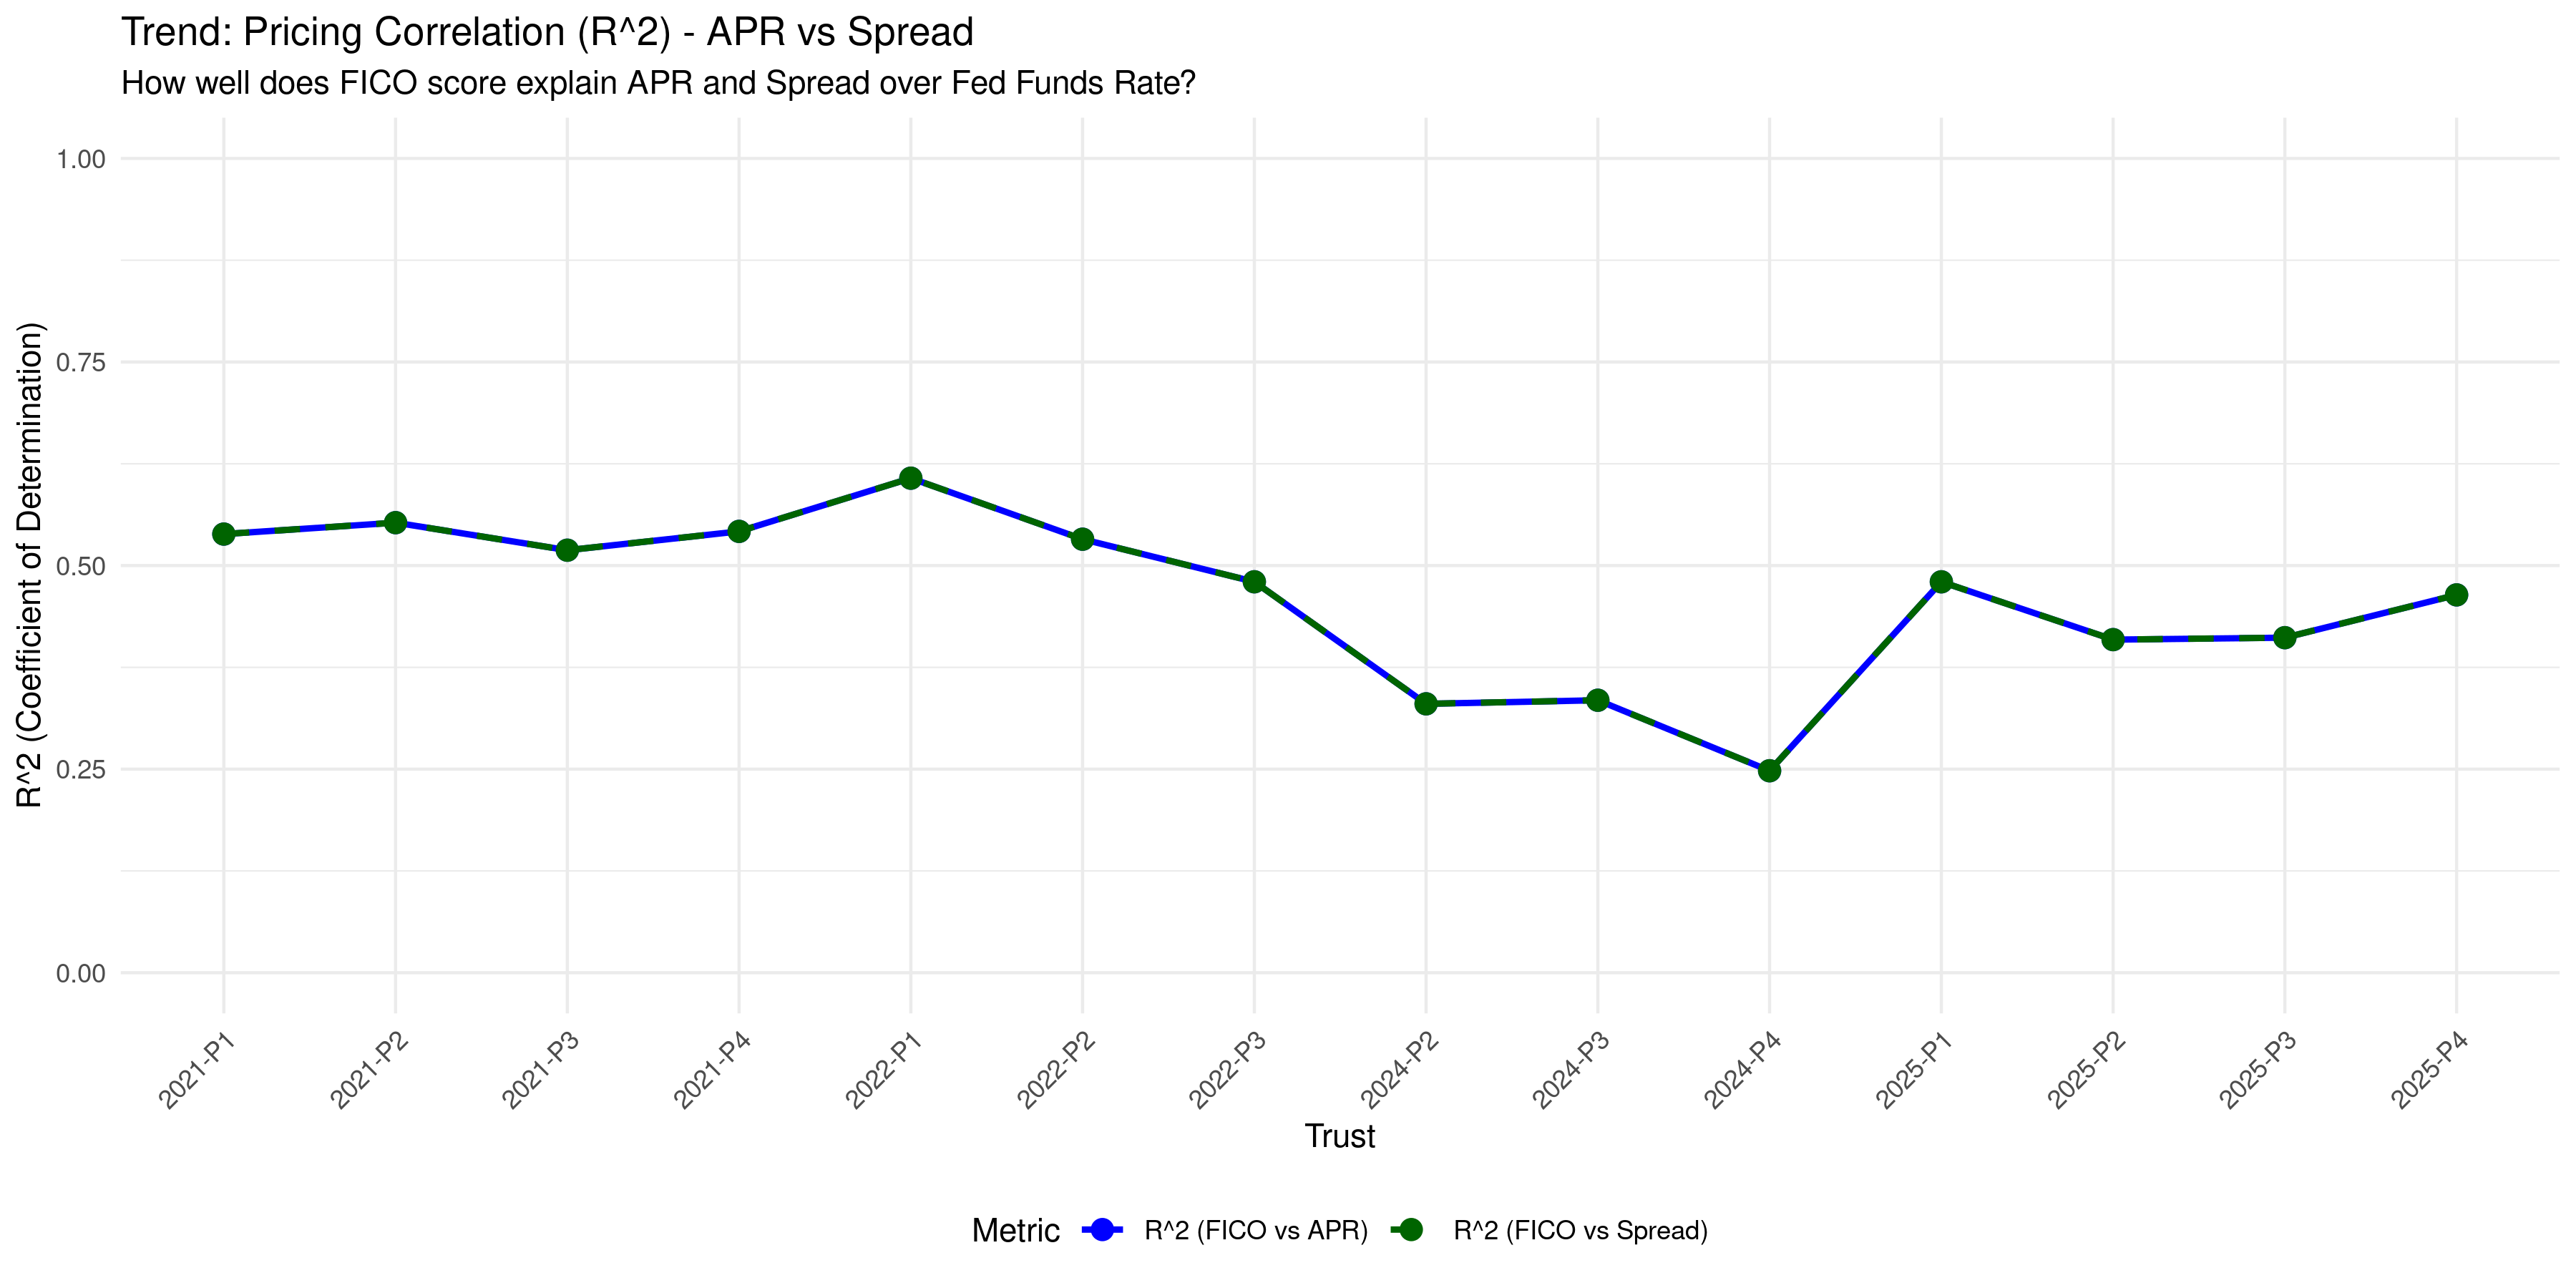
Figure 7: The Collapse of Risk-Based Pricing
THE MONEY CHART. R² measures how much of the variance in APR (or spread over Fed Funds Rate) is explained by FICO scores. In a traditional prime auto lender, this should be 0.60-0.80 (credit scores strongly predict rates). From 2021-2022, Carvana operated normally: R² averaged 0.50-0.60. Beginning in 2022-P3, R² collapsed, reaching a nadir of 0.25 in 2024-P4. At this point, FICO scores explained only 25% of pricing variance—the remaining 75% was determined by undisclosed factors. This is statistical evidence of abandoning risk-based pricing.
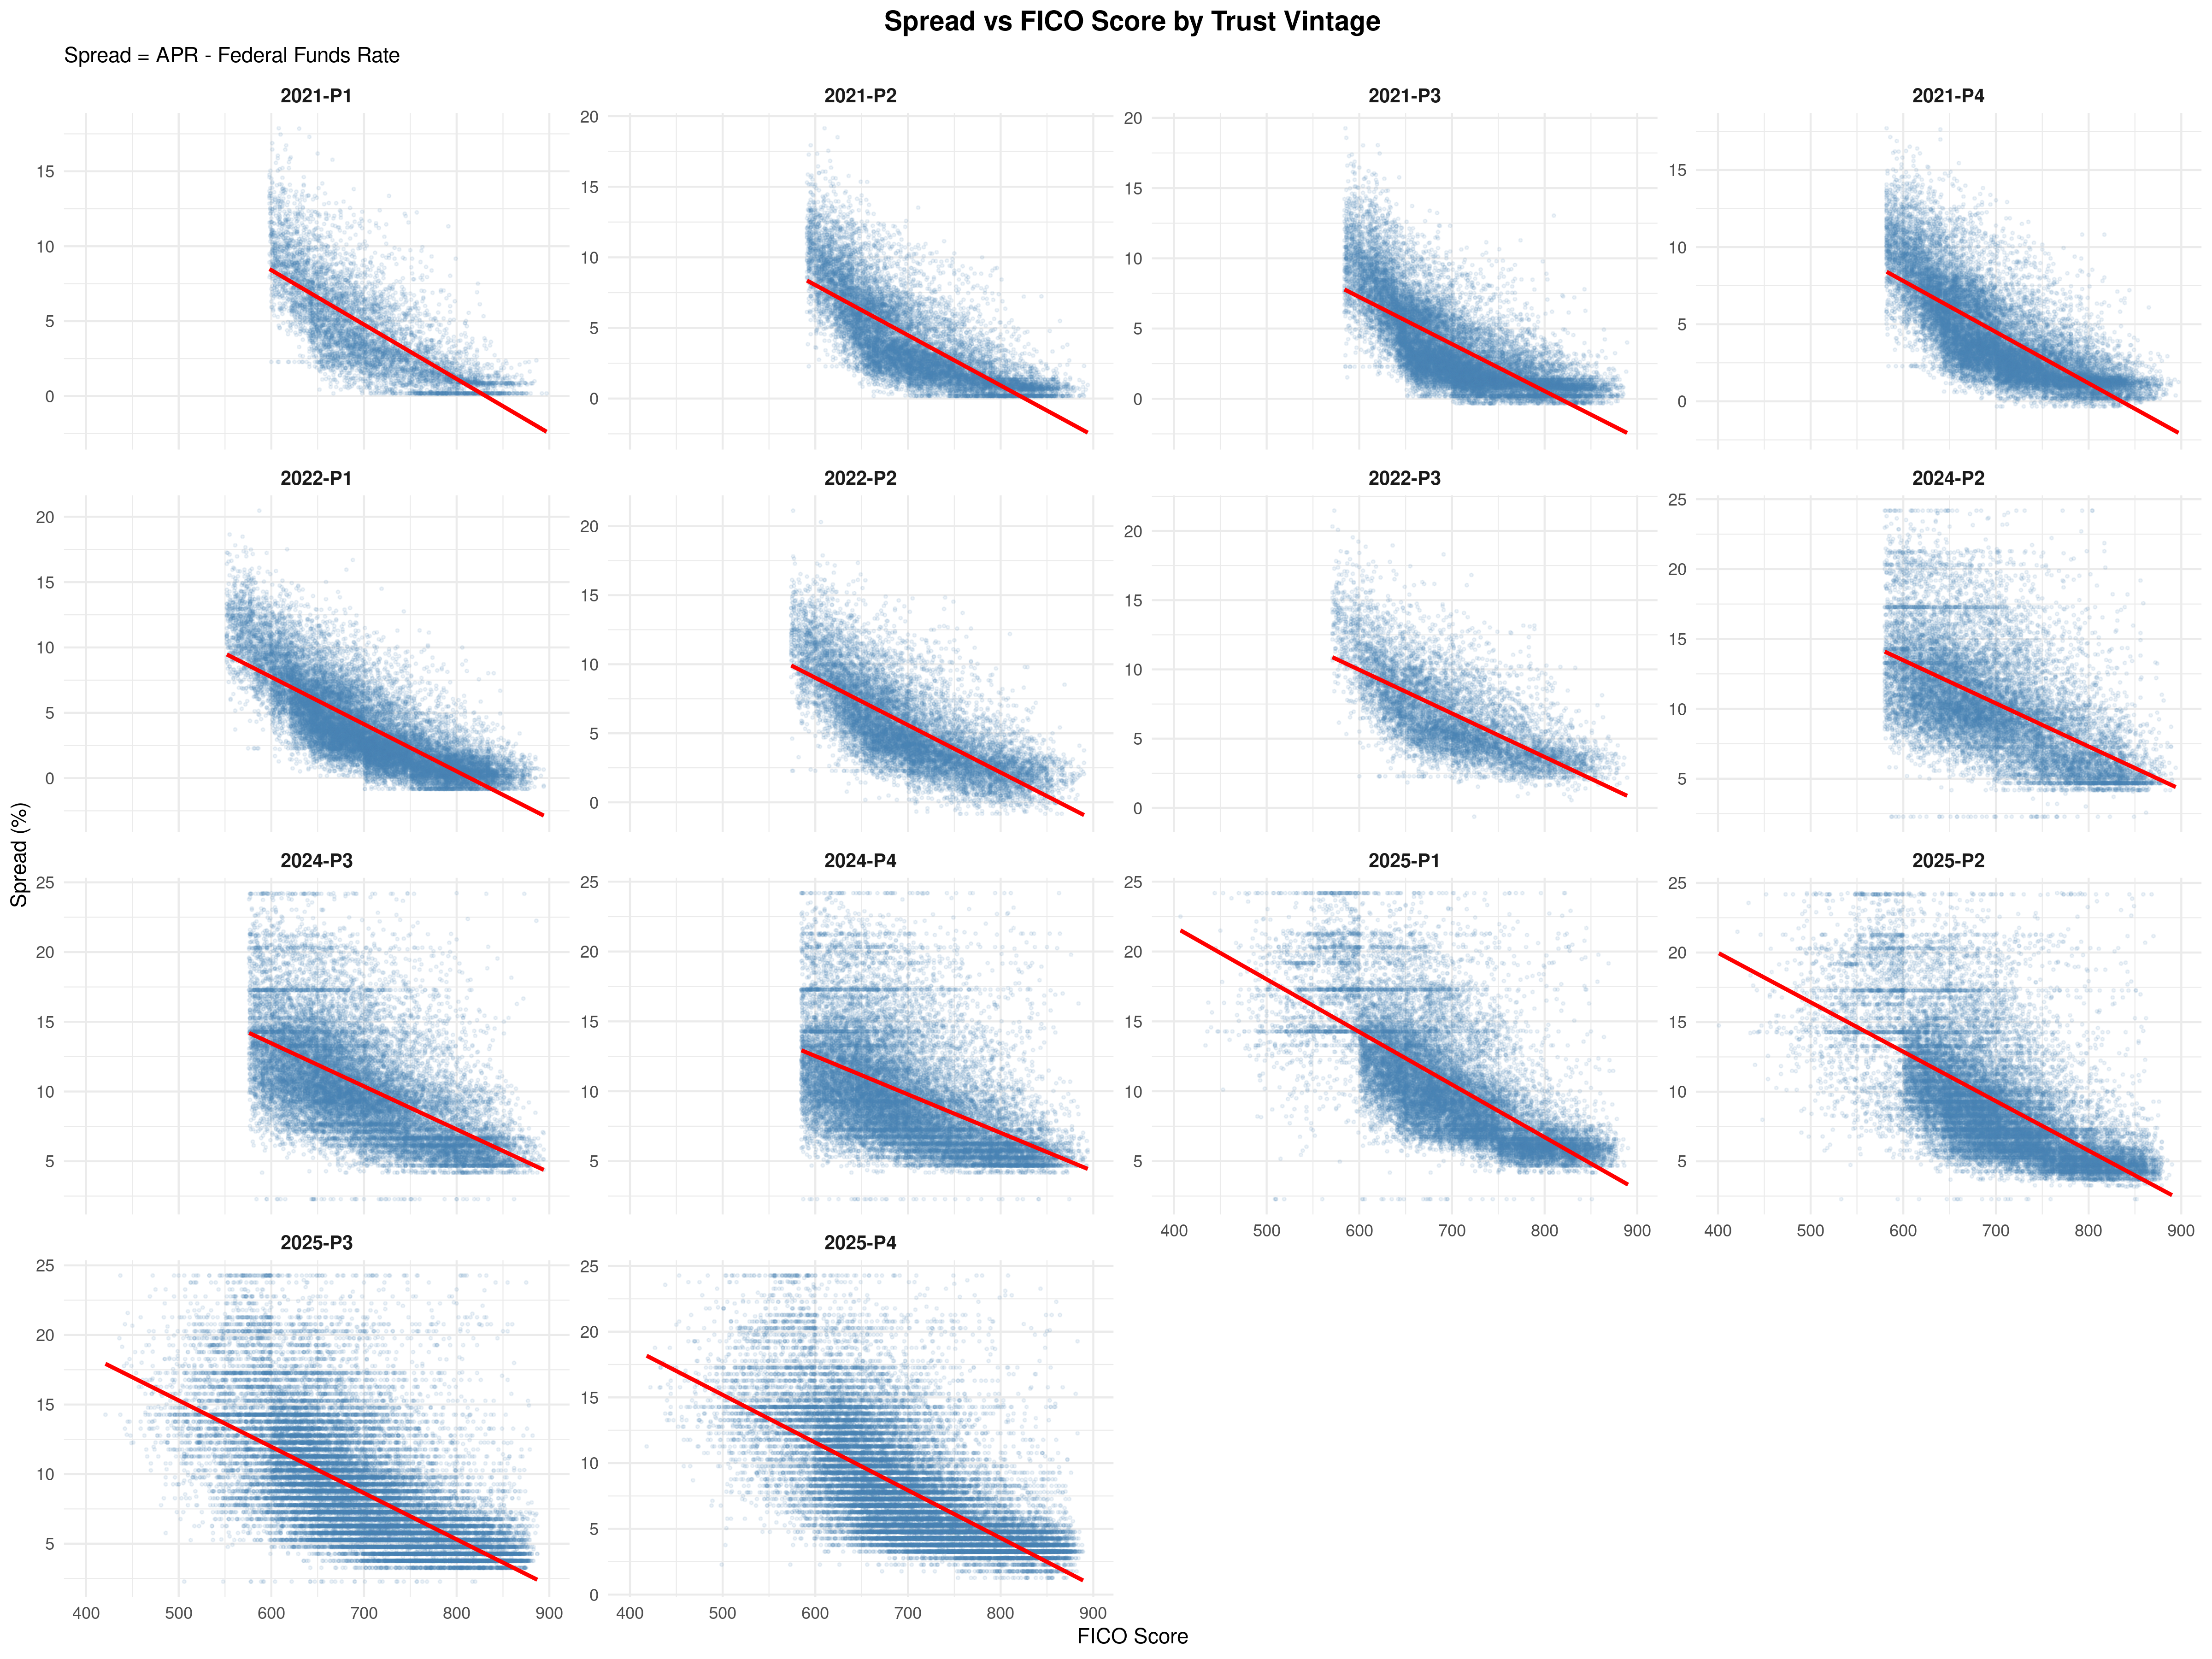
Figure 8: Visual Proof of the Decoupling
Small multiples showing FICO vs. Spread for each vintage. In 2021-2024 vintages, the relationship is tight and downward-sloping (higher FICO = lower spread). By 2024-2025, the scatter plots show horizontal “clouds”—borrowers across a wide FICO range (600-800) receiving similar spreads. The linear relationship has vanished.
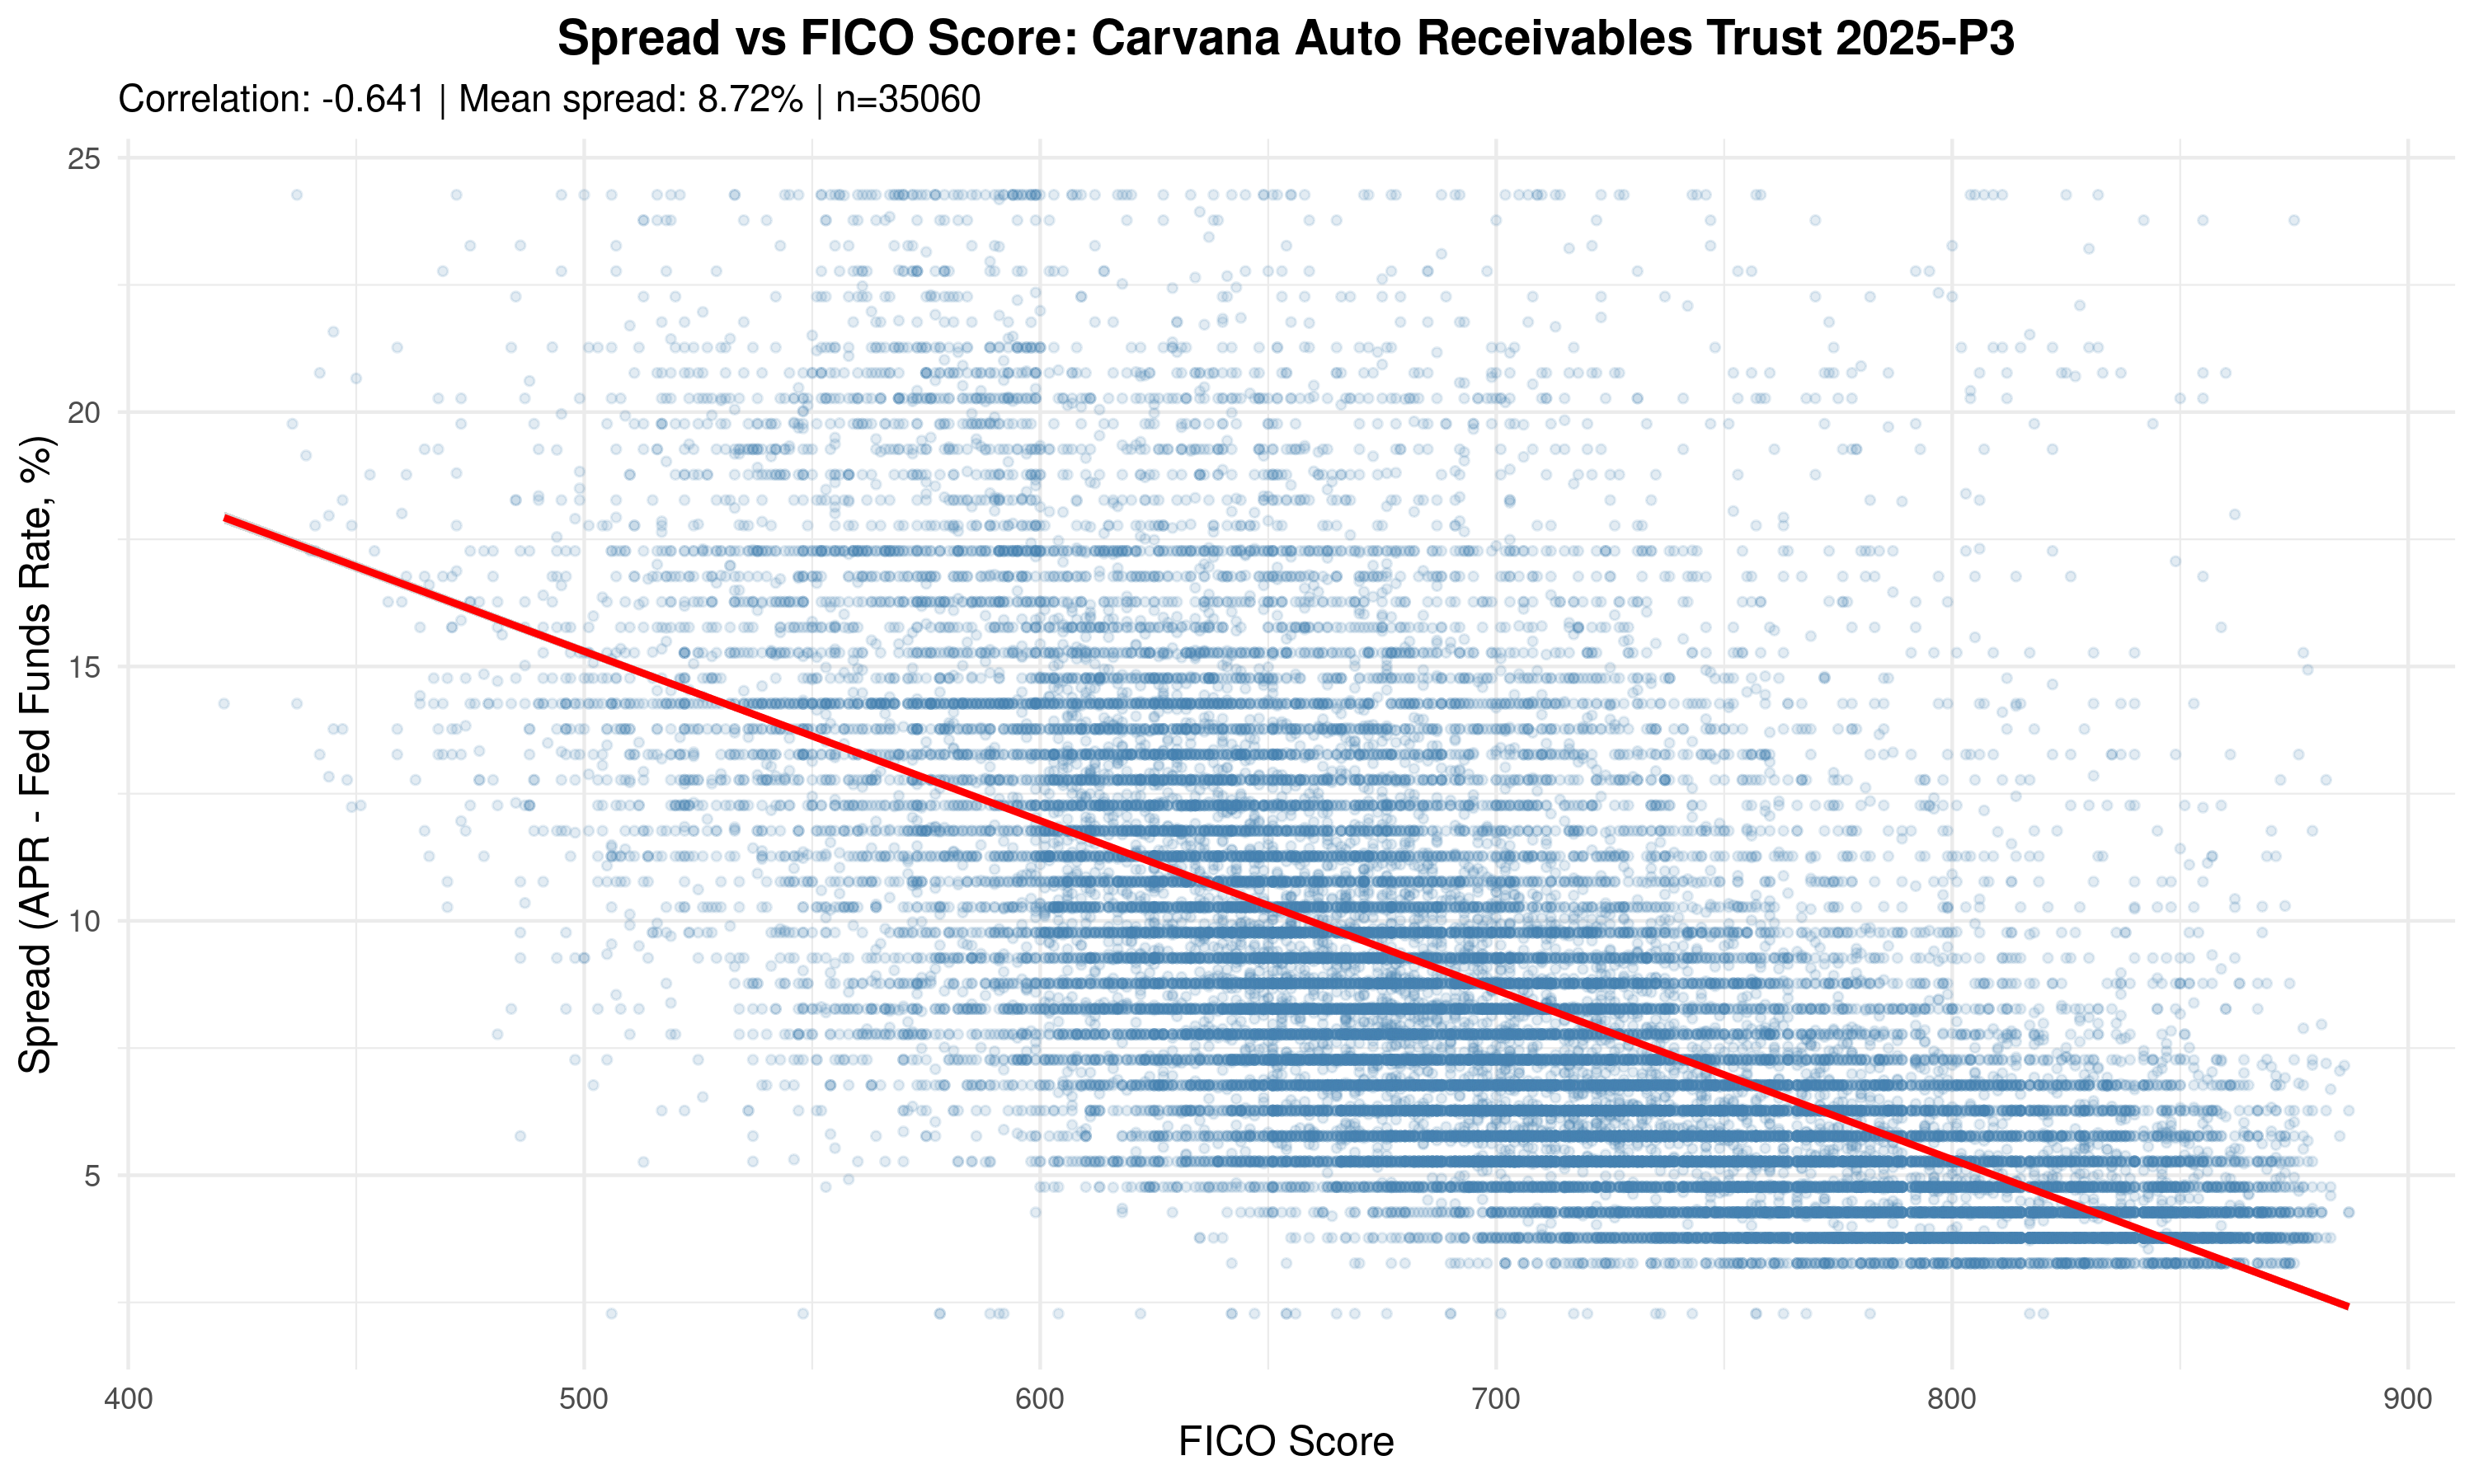
Figure 9: Even in 2025, Correlation Remains Weak
Spread vs. FICO for 2025-P3 (35,060 loans). Correlation: r = -0.641 (moderate negative, but much weaker than the -0.75 to -0.85 typical of prime underwriting). Note the horizontal banding—multiple distinct clusters of borrowers at similar spreads despite 200+ point FICO differences. Carvana is pricing on factors other than creditworthiness.
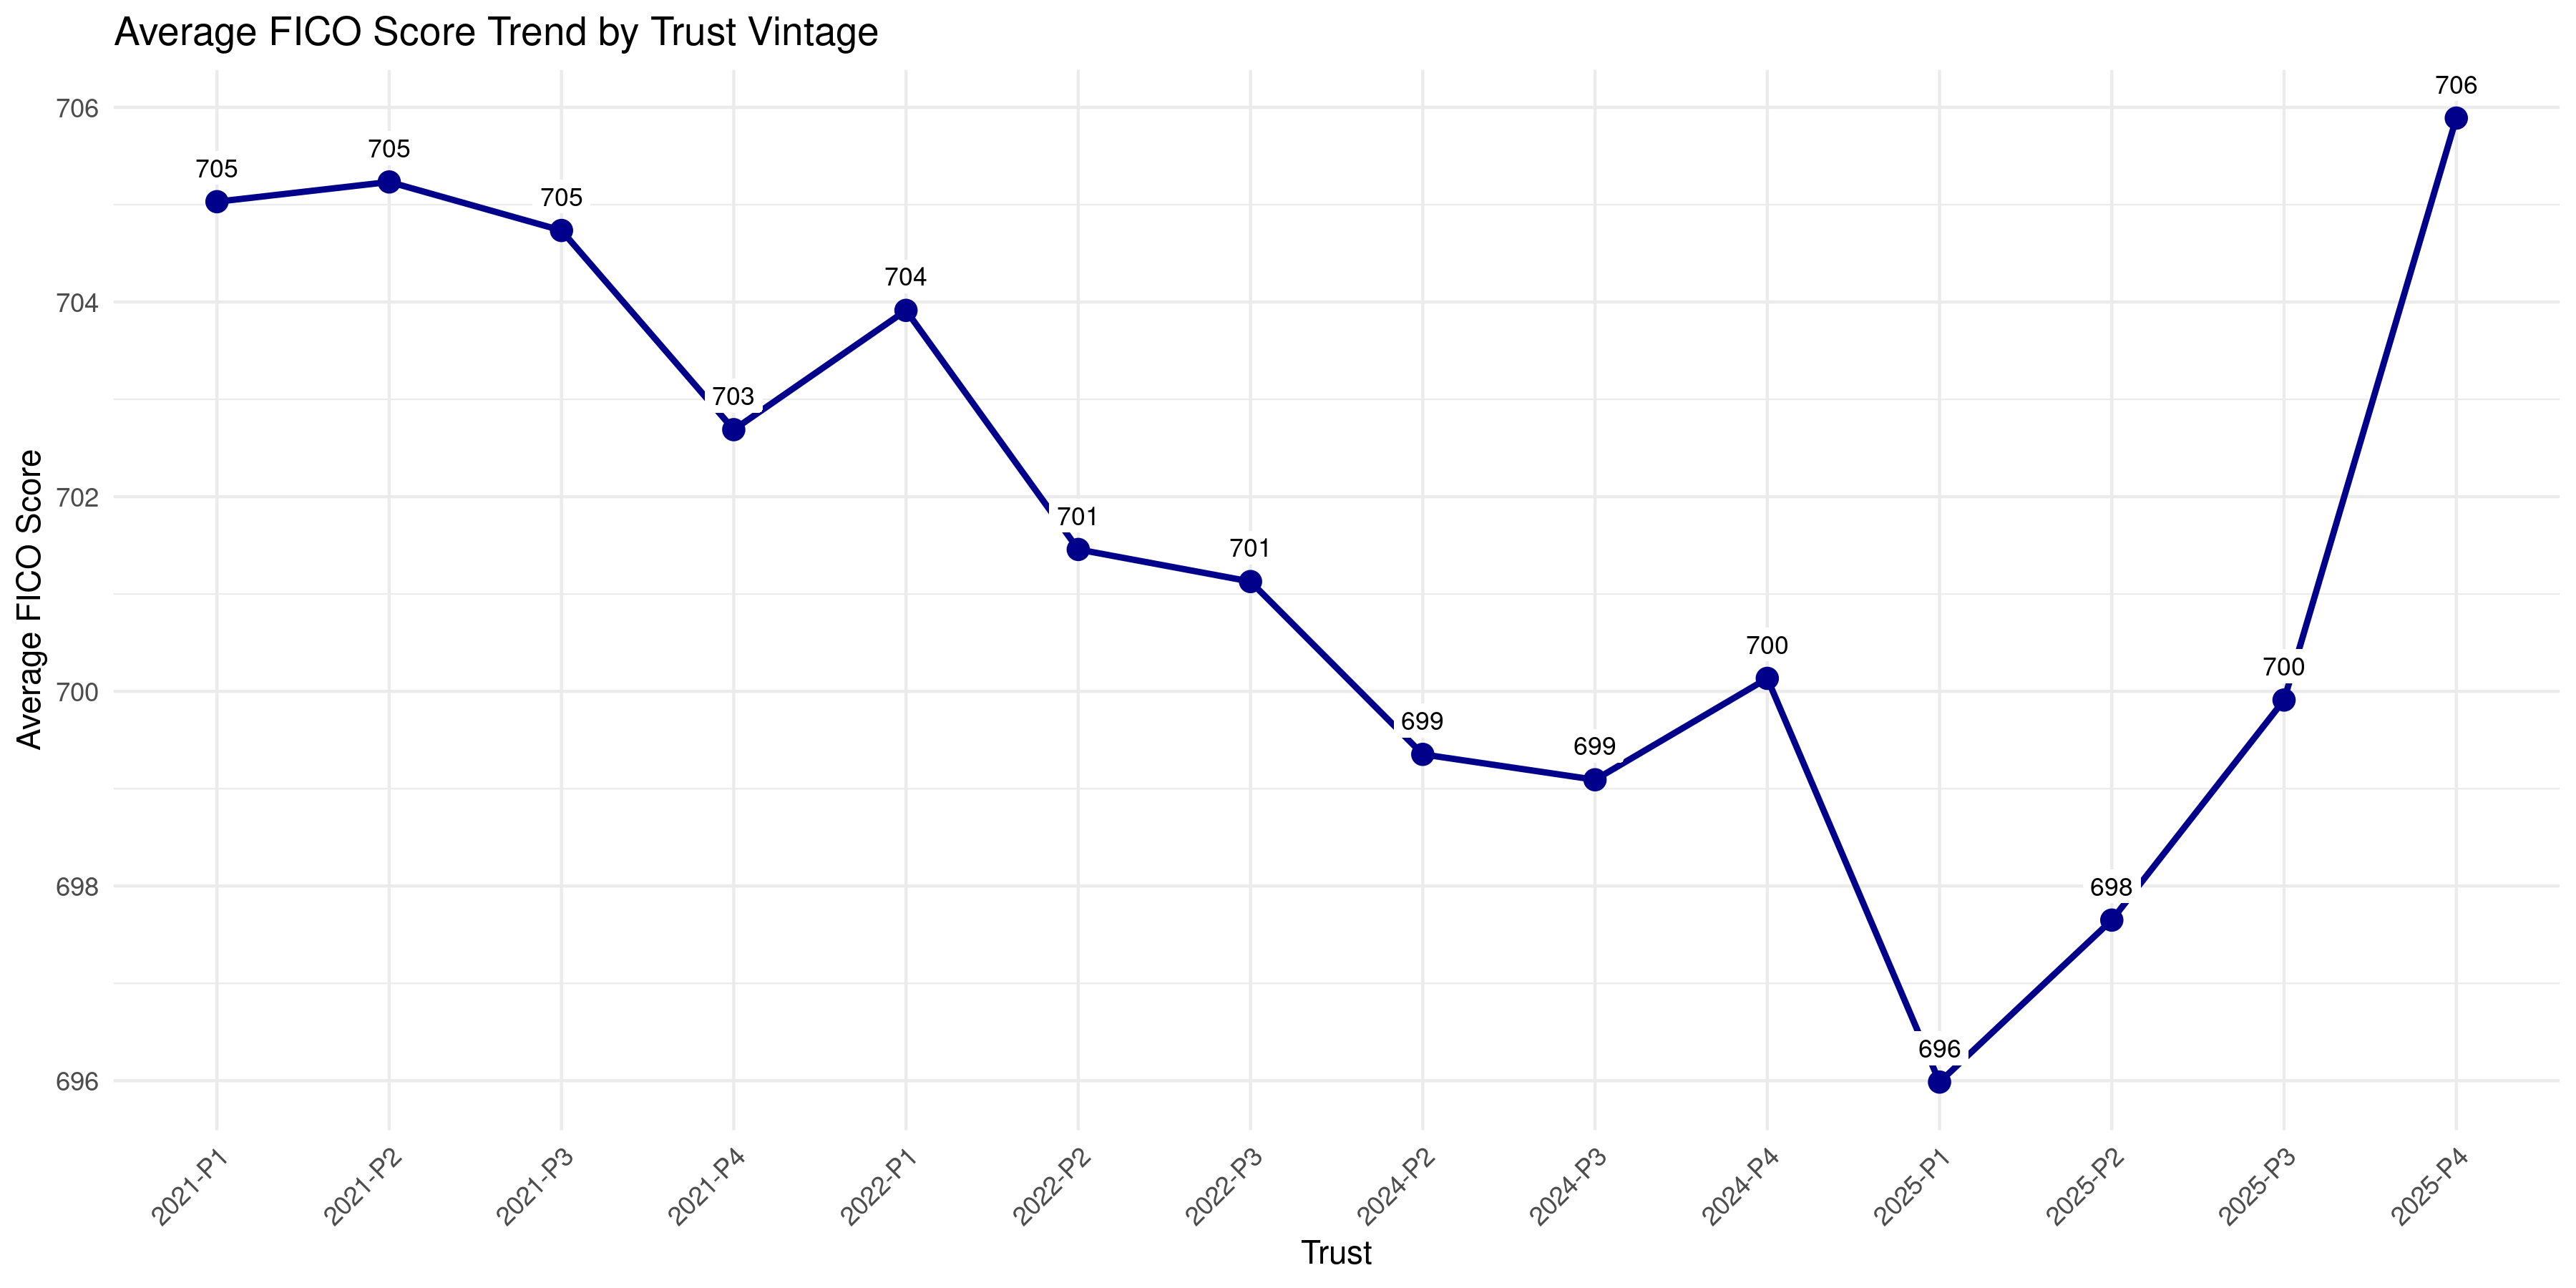
Figure 10: Average FICO Masks Composition Changes
Average FICO dropped from 705 (2021) to 696 (2025-P1), then recovered to 706 (2025-P4). This might suggest credit quality is stable. However, this average masks composition changes: Carvana added sub-550 FICO borrowers (3% of 2025 pools) while simultaneously adding high-FICO borrowers, averaging out to a similar number. The distribution widened significantly, indicating increased heterogeneity and risk.
Pillar 2b: The Sub-550 Cohort
- The Finding: 2025 vintages contain ~3% sub-550 FICO borrowers. 2021-2024 vintages had 0%.
- What this means: Carvana crossed a line they’d never crossed before. Sub-550 is deep subprime.
- Historical auto loan default rates by FICO:
- 720+: ~2% cumulative default rate
- 650-720: ~8%
- 600-650: ~15%
- 550-600: ~25%
- <550: ~40%+
- The math: If 3% of the pool (~1,000 loans) defaults at 40% rate, that’s 400 defaults. At $35K average loan size, that’s $14M in losses from this cohort alone. Spread that across a $435M pool and you’re looking at 3.2% losses just from the sub-550 segment.
- Subordination on 2025-P1: 14.1% ($61.5M). The buffer exists, but it’s not unlimited.
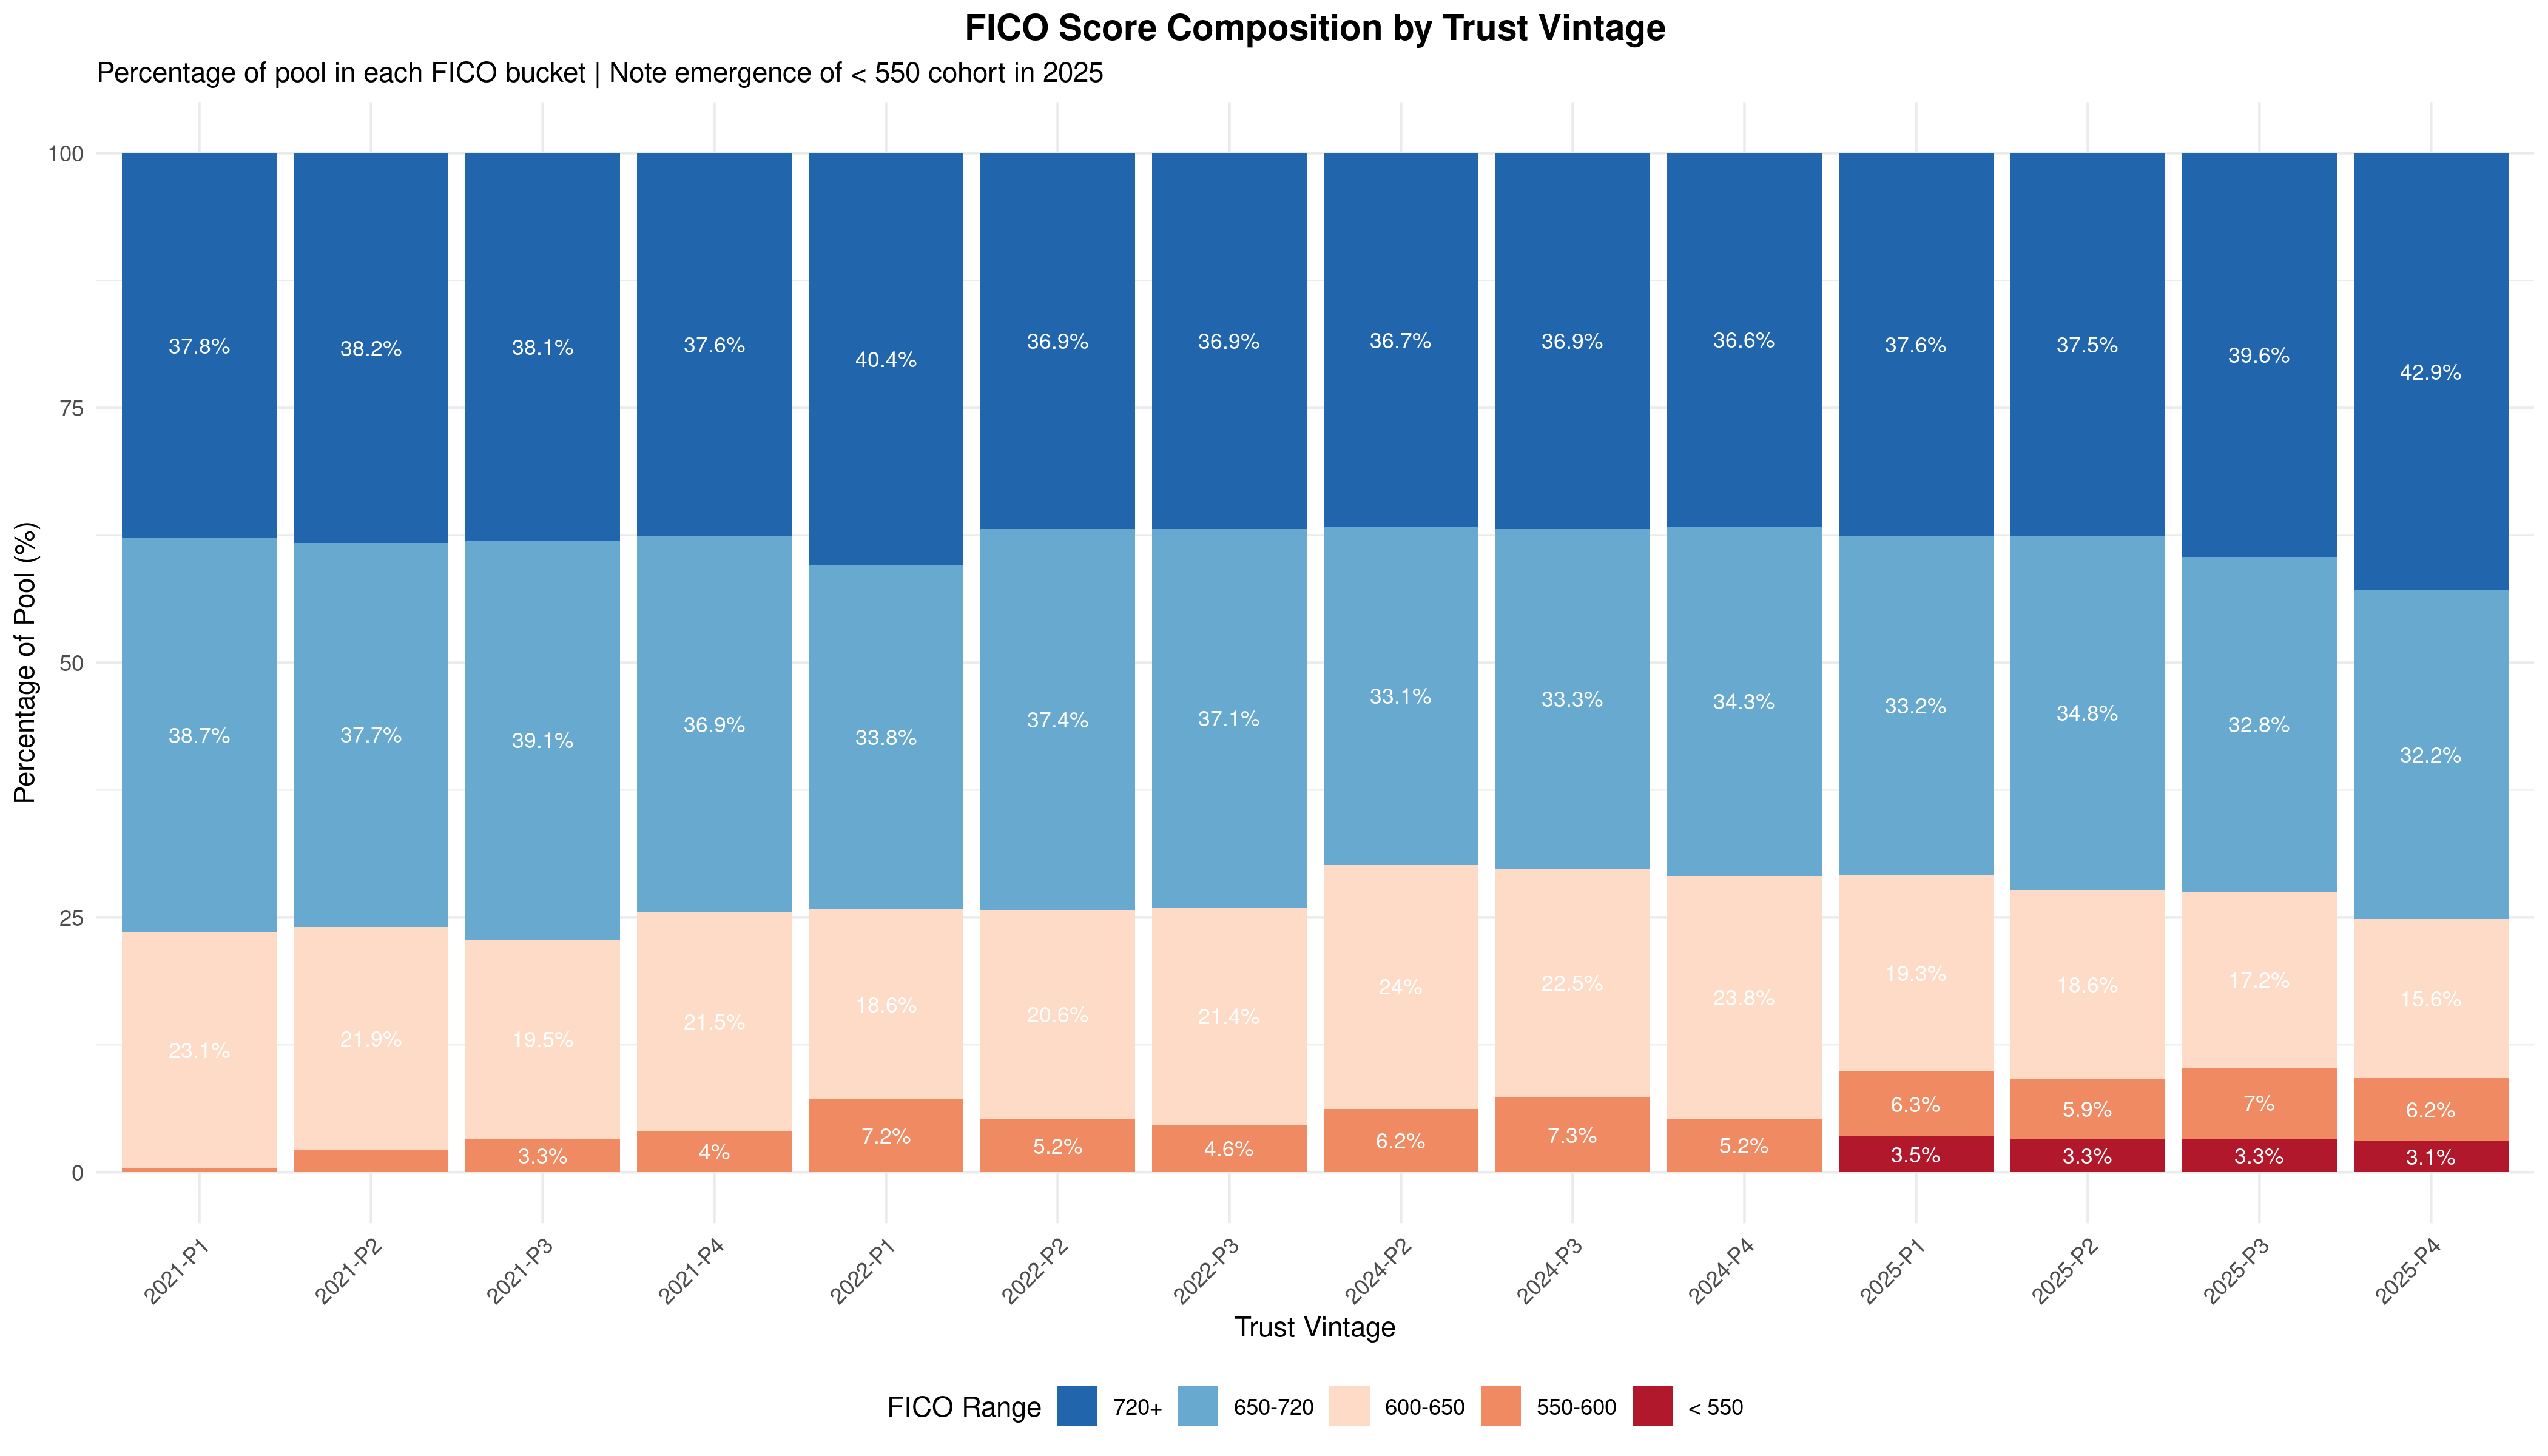
Figure 10b: FICO Score Composition Shift
Stacked bar chart showing the percentage of each pool in five FICO buckets. The < 550 cohort (deep subprime, dark red) is completely absent from 2021-2024 vintages but appears at 3.1-3.5% in every 2025 vintage. Simultaneously, the 550-600 and 600-650 buckets expand, while the 720+ share stays roughly constant. The average FICO masks this widening distribution — the tails got fatter in both directions.
Pillar 3: The Underwater Collateral Crisis
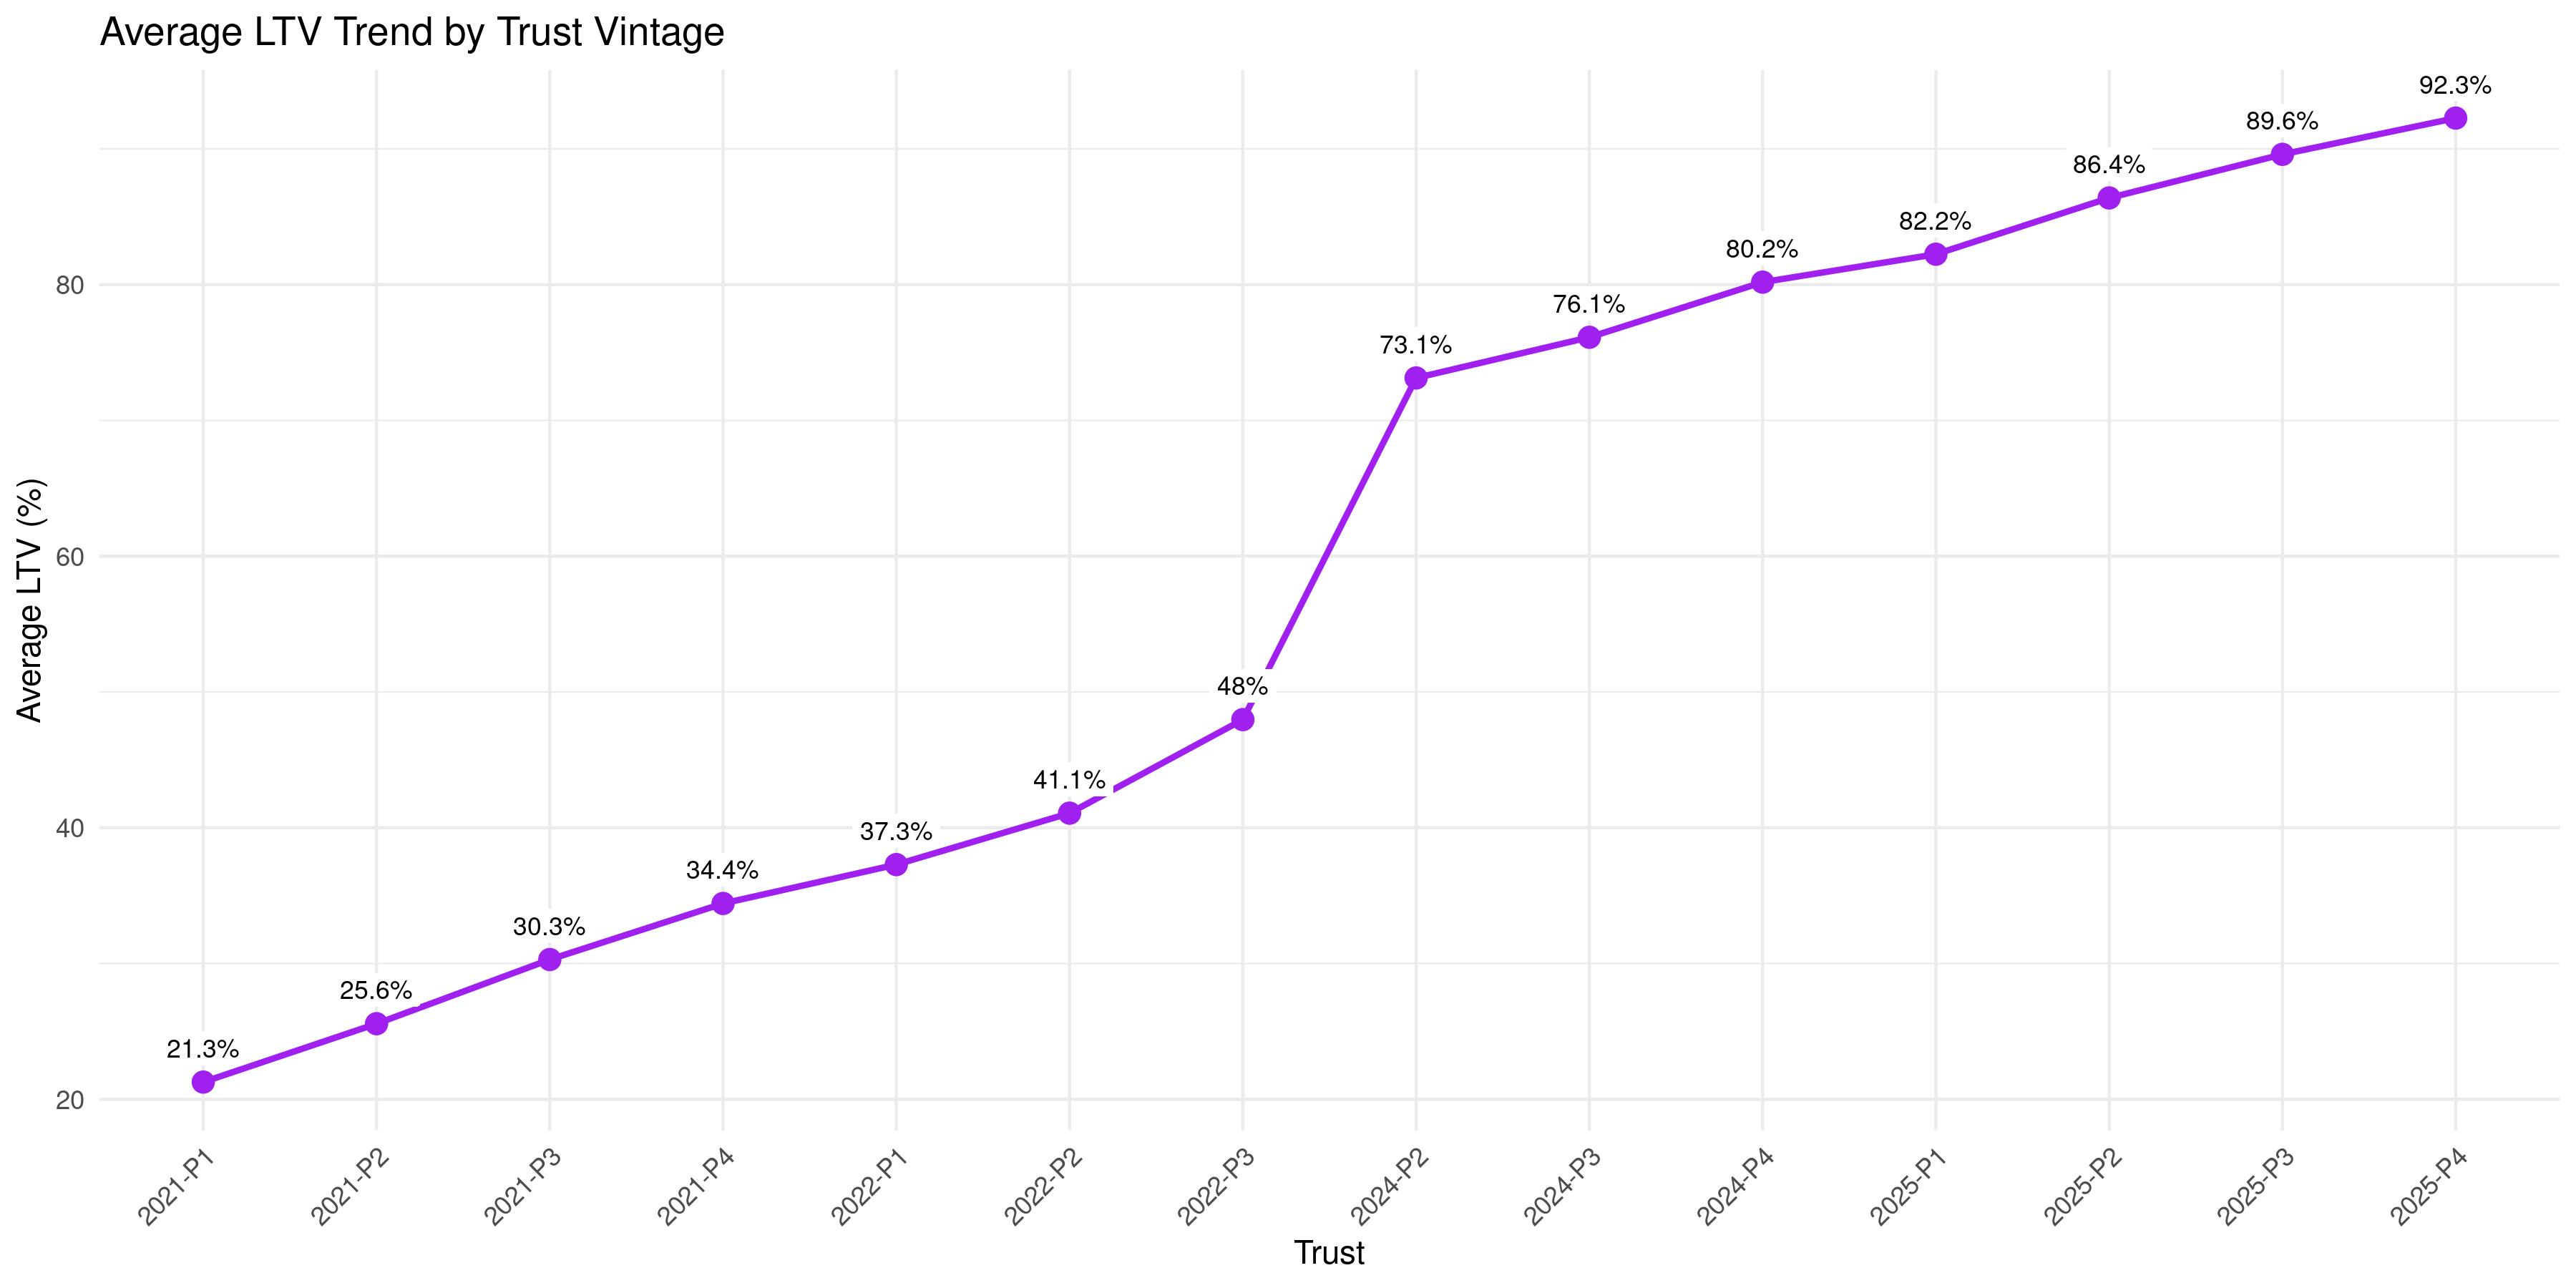
Figure 12: Average LTV Climbs to 92%
Average LTV at origination increased from 21.3% (2021-P1) to 92.3% (2025-P4). The 2024-P2 inflection point (from ~48% to 73% in a single vintage) coincides with the pivot to extended terms. By 2025, the average borrower has less than 8% equity in their vehicle. Combined with 73-month terms, most borrowers will remain underwater for 18-24 months, creating a structural default pathway.
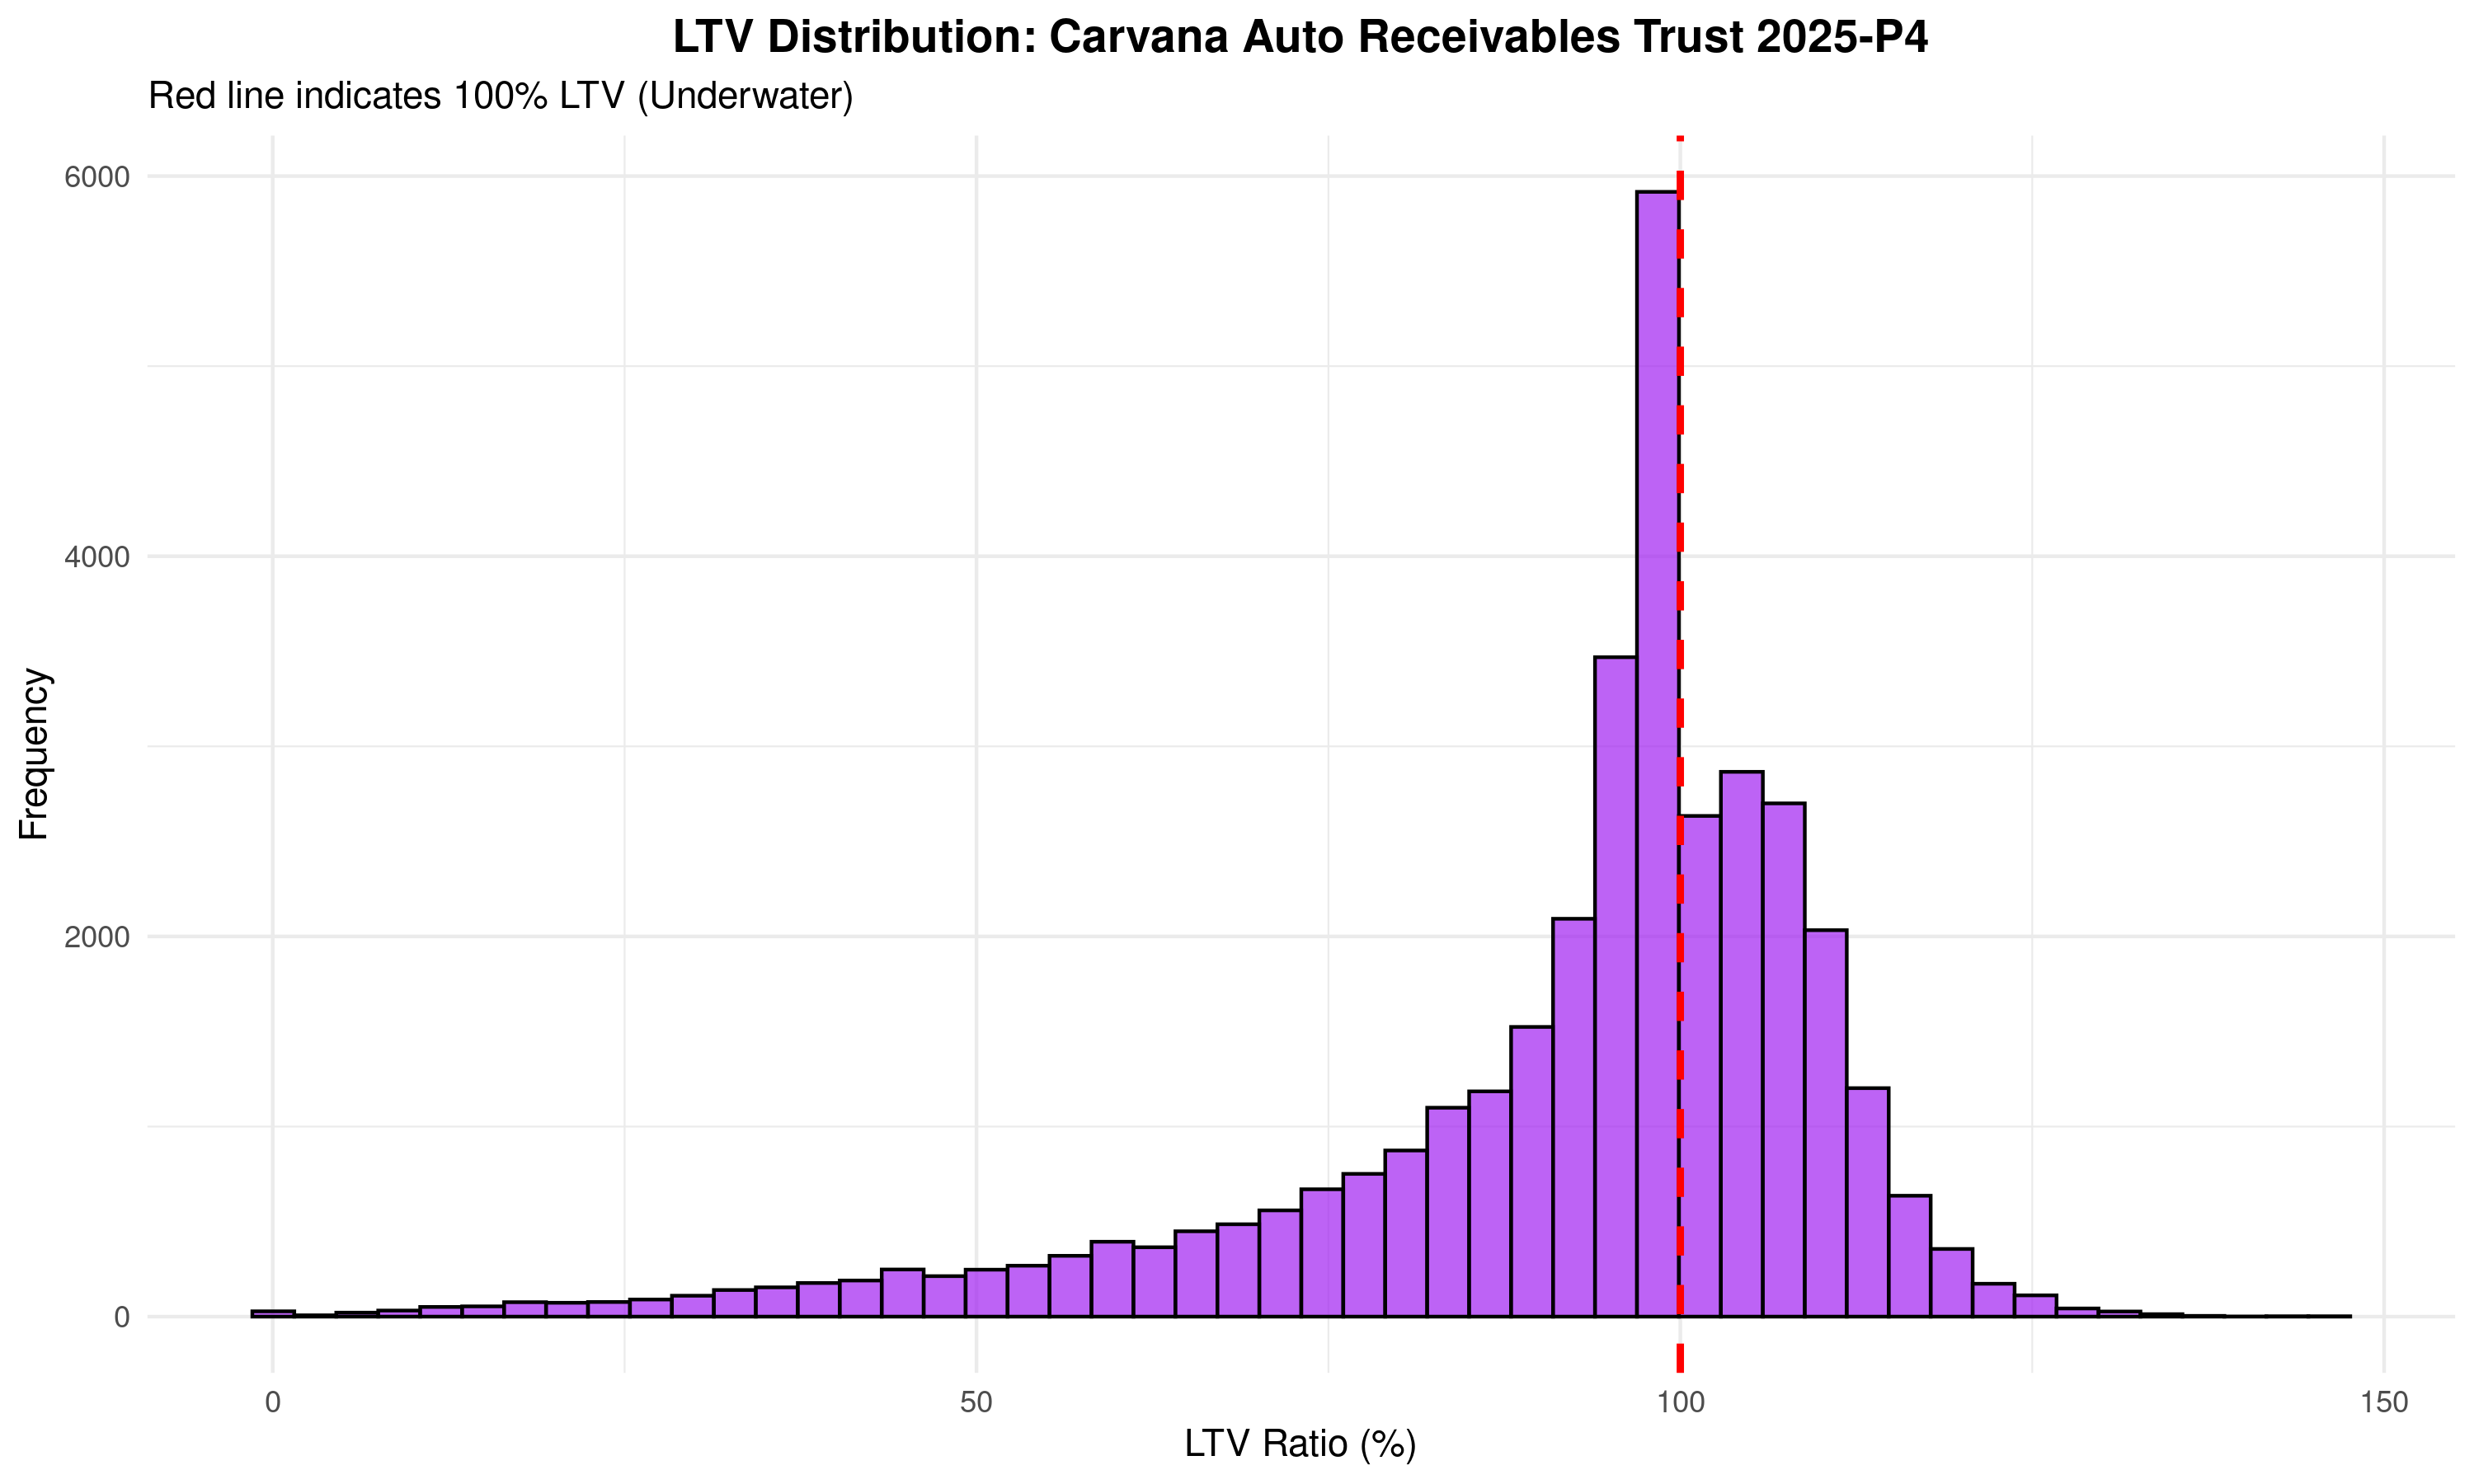
Figure 13: The Distribution Reveals Depth of Problem
Histogram of LTVs in 2025-P4 (33,943 loans). Red line marks 100% LTV. Modal LTV is 95-100%, but a significant tail extends above 110%, with some loans exceeding 120% LTV. These deeply underwater borrowers have no incentive to continue payments in the event of income shock. Recovery value on default will be near-zero, driving Loss Given Default (LGD) to 60-80% vs. the 20-30% typical of positive-equity auto loans.
- The Finding: 36.1% of 2025-P4 pool has LTV > 100% at origination.
- How we got here: 73-month loan terms slow principal paydown. Vehicle depreciation (15-20% year 1, 10-15% year 2) outpaces amortization.
- The math:
- Standard depreciation: Value_t = Value_0 * e^(-kt), where k ≈ 0.15
- 73-month amortization: Balance_t declines too slowly to catch up
- Result: “equity inflection point” pushed 18+ months into loan lifecycle
- Loss Given Default (LGD) impact:
- Normal auto loan: borrower has equity, sells car to repay. LGD = 20-30%.
- Underwater loan: borrower walks away, lender repossesses and sells at loss. LGD = 60-80%.
- Strategic default risk: When a borrower has no equity and faces economic stress (job loss, income shock), the rational move is to stop paying and let the lender repossess. High LTV loans incentivize default.
- Current pool status: ~12,000 loans in 2025-P4 alone are underwater. If even 10% default, that’s 1,200 defaults at high LGD.
Pillar 4: Trigger Management (The Smoking Gun)
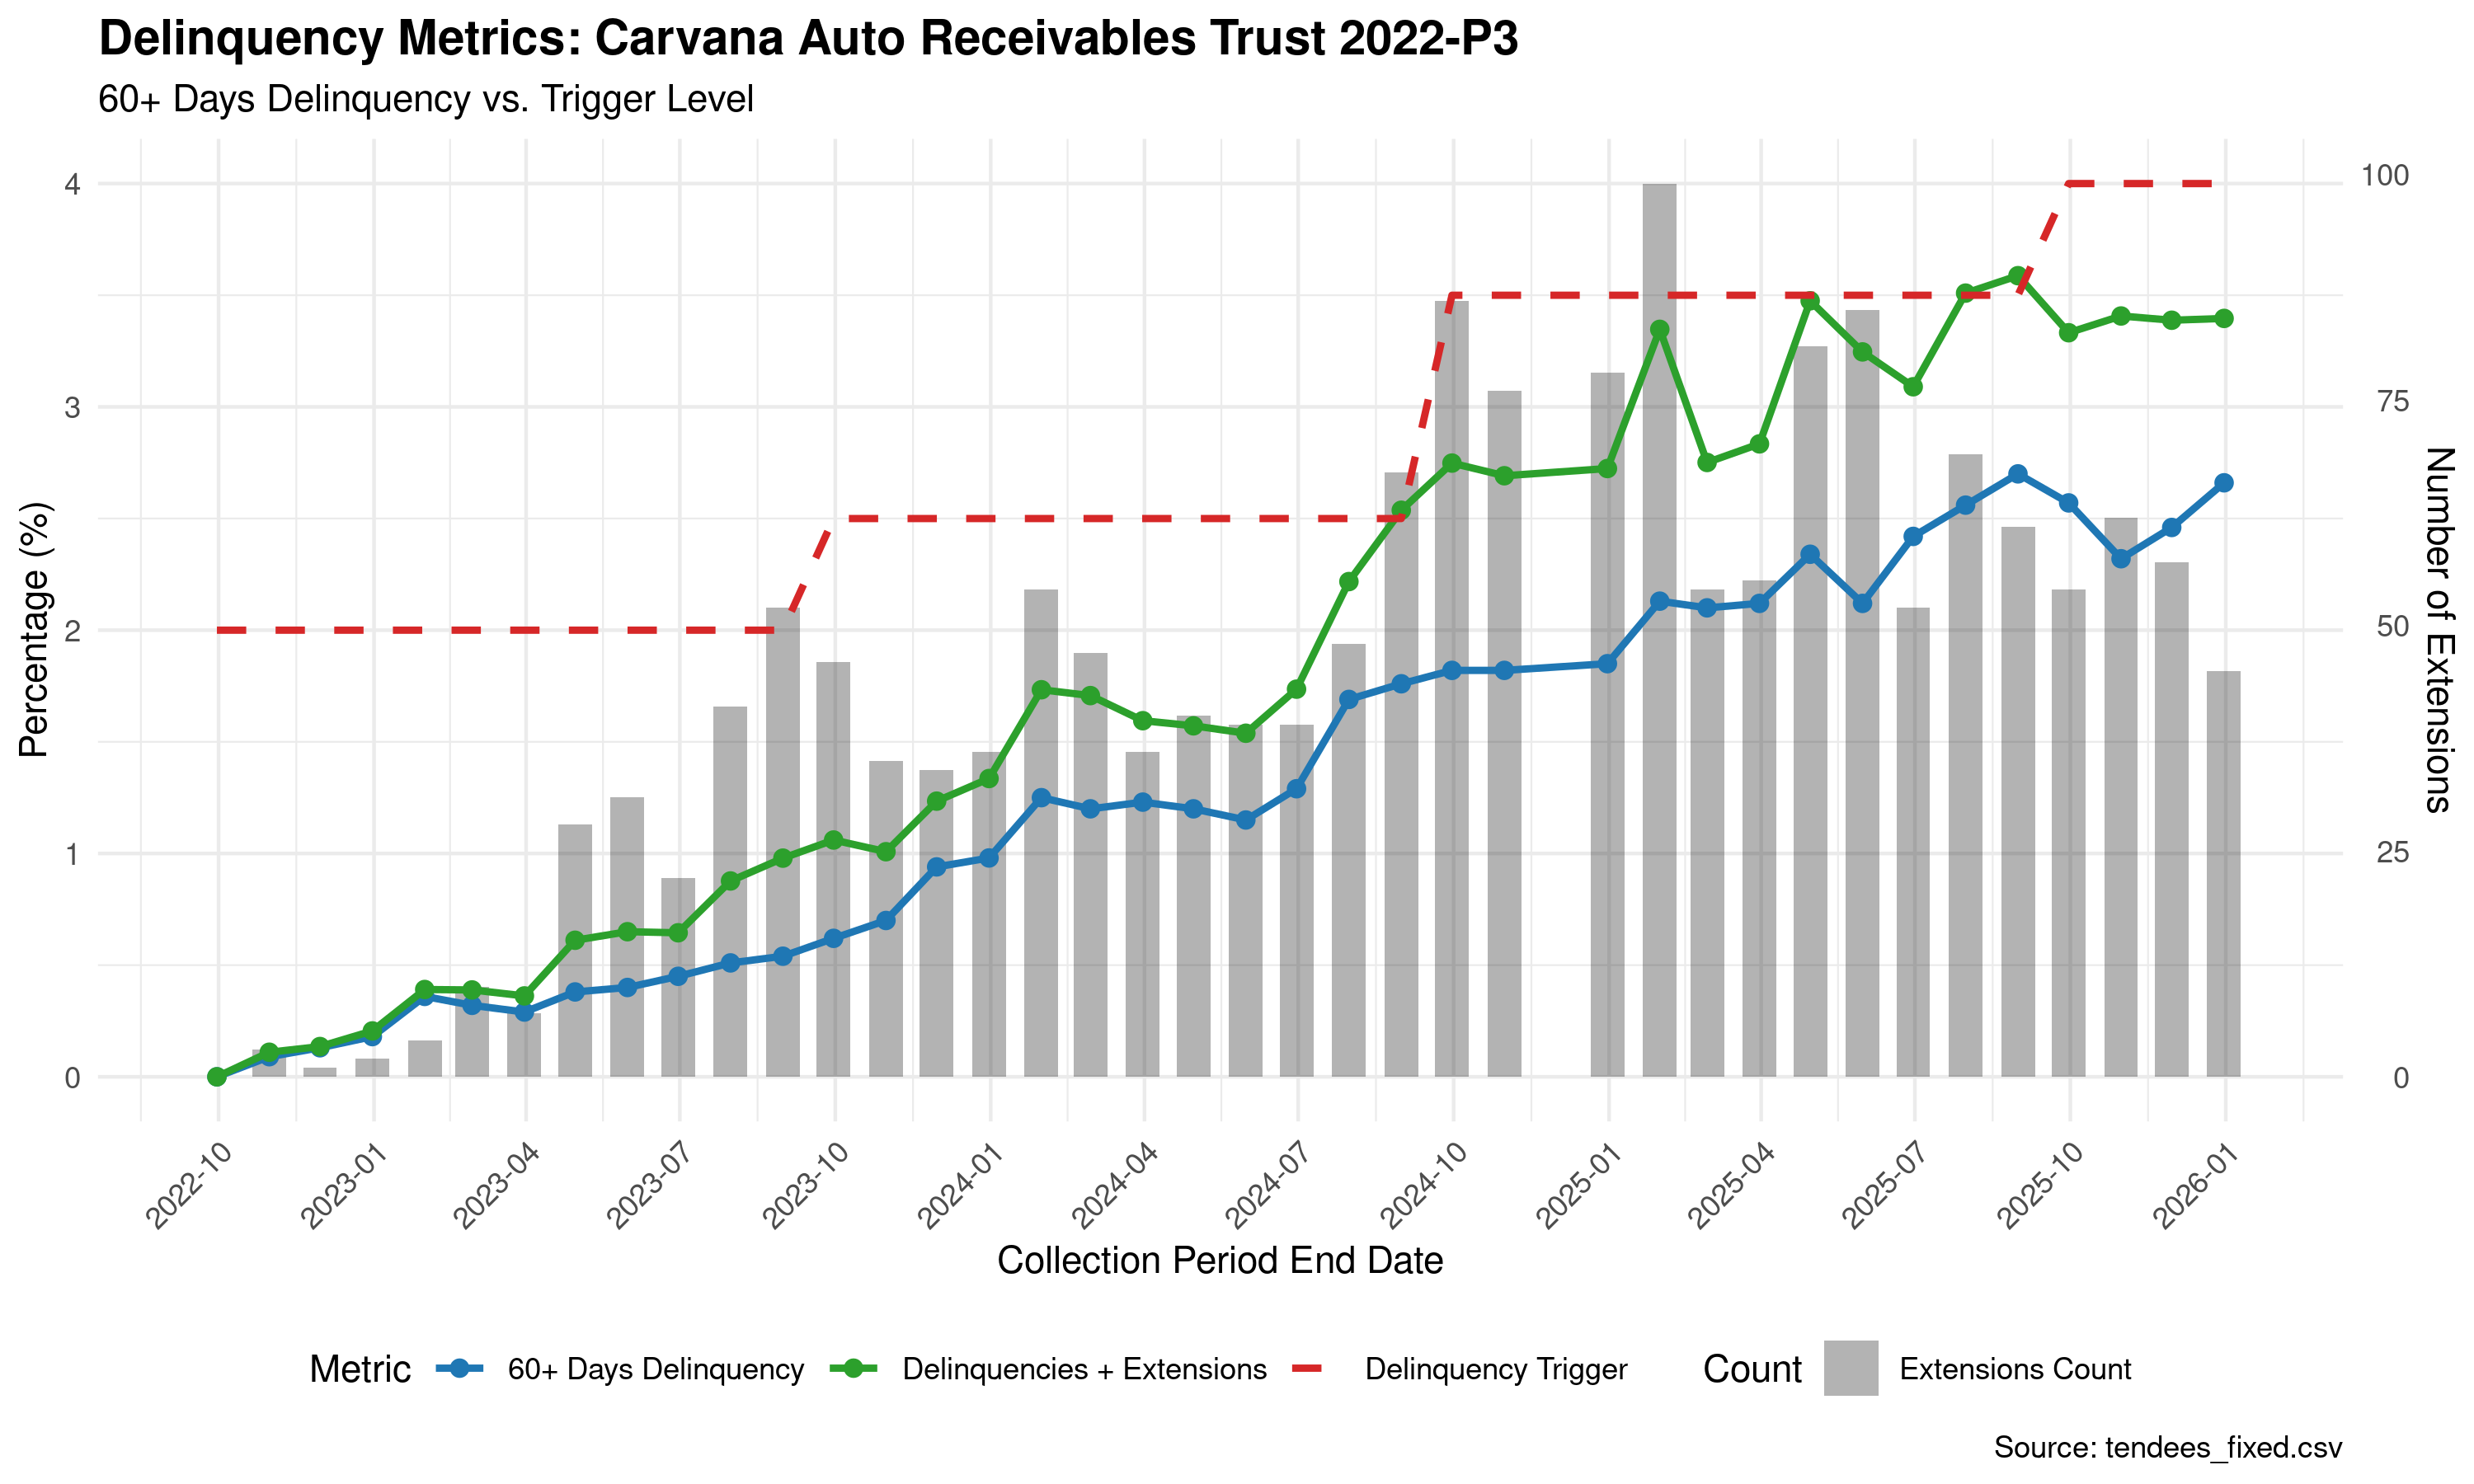
Figure 14: The Smoking Gun - 2022-P3 Vintage
Blue line: reported 60+ day delinquency. Green line: adjusted delinquency (including extensions). Red dashed line: trigger threshold from trust indenture. Gray bars: number of extensions granted each month. The pattern: Extensions spike to 100/month precisely when adjusted delinquency approaches 4%. The trigger threshold jumps from 2.5% to 4.5% (a managed increase), and extensions cluster at the inflection point. Reported delinquency stays under 3.5% while adjusted delinquency exceeds 3.5%. This is not random—it is systematic management of reported metrics.
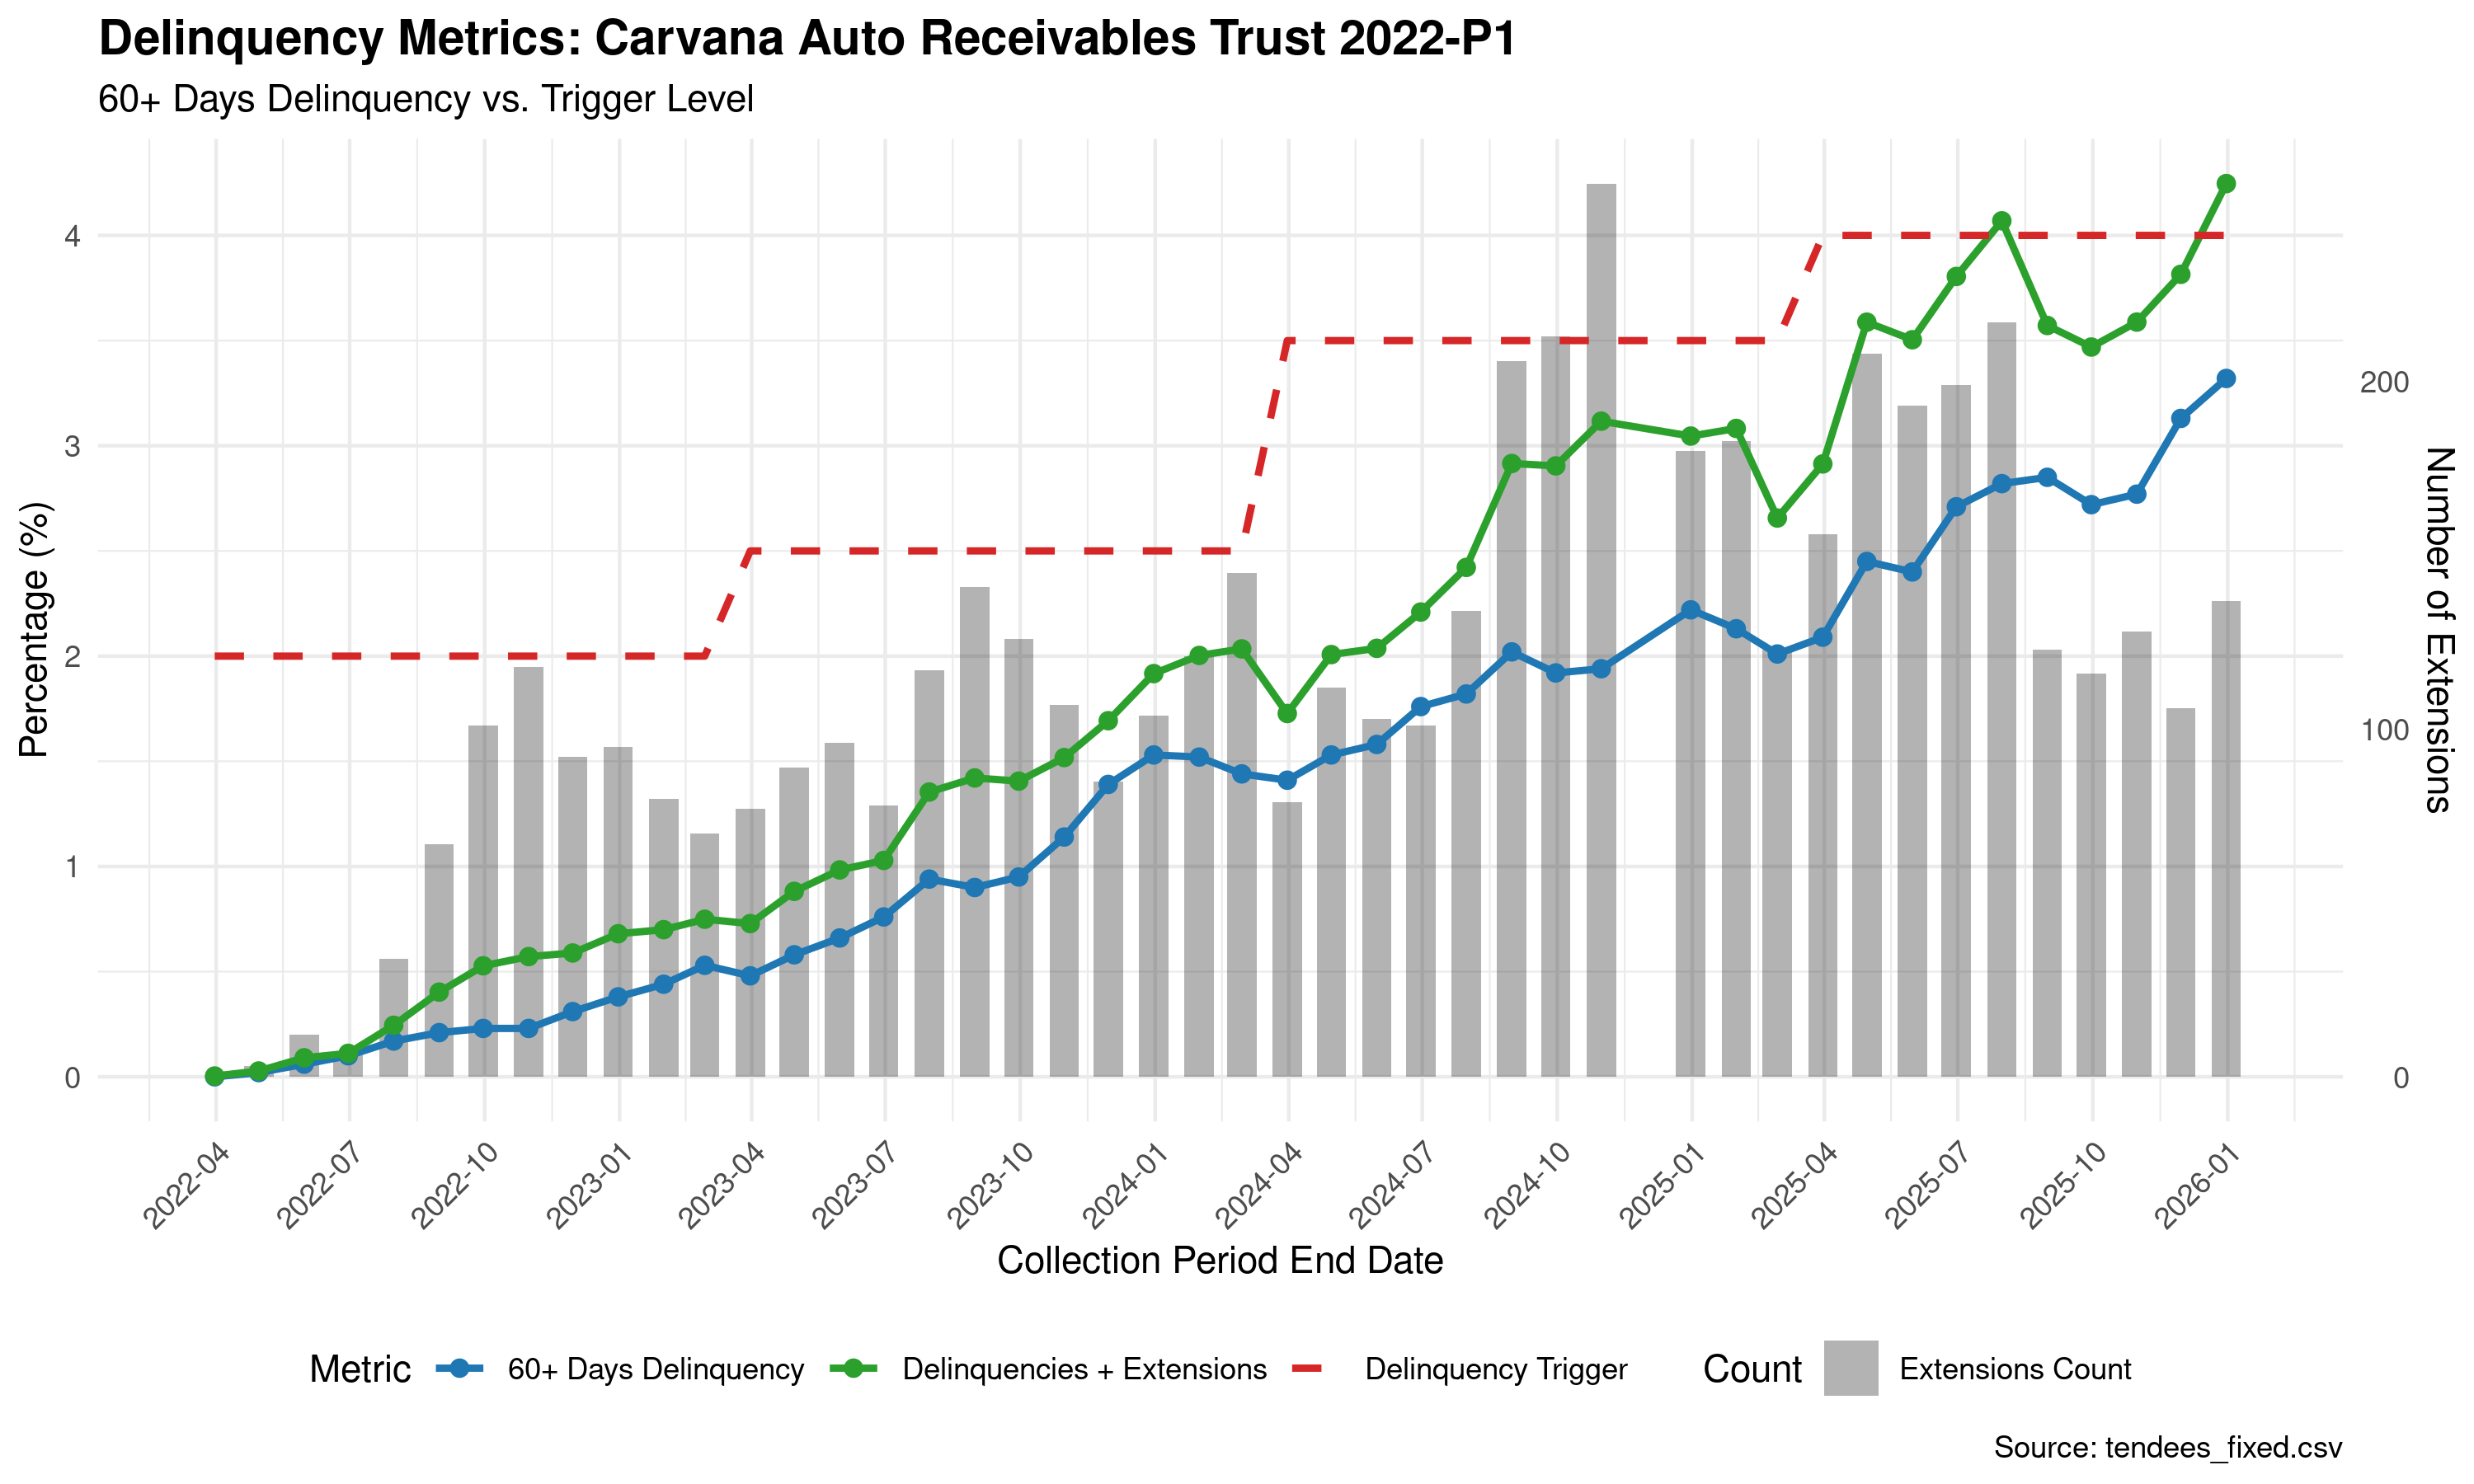
Figure 15: Extensions Surge to 200/Month - 2022-P1
Same pattern, more dramatic. Extensions hit 200+/month in late 2024/early 2025 as adjusted delinquency reaches 4%+. The trigger threshold increases from 2% → 3.5% → 4%. Reported delinquency stays below 3.5% while adjusted delinquency climbs to 4.3%. The gap between blue and green lines widens precisely when the trigger is threatened.
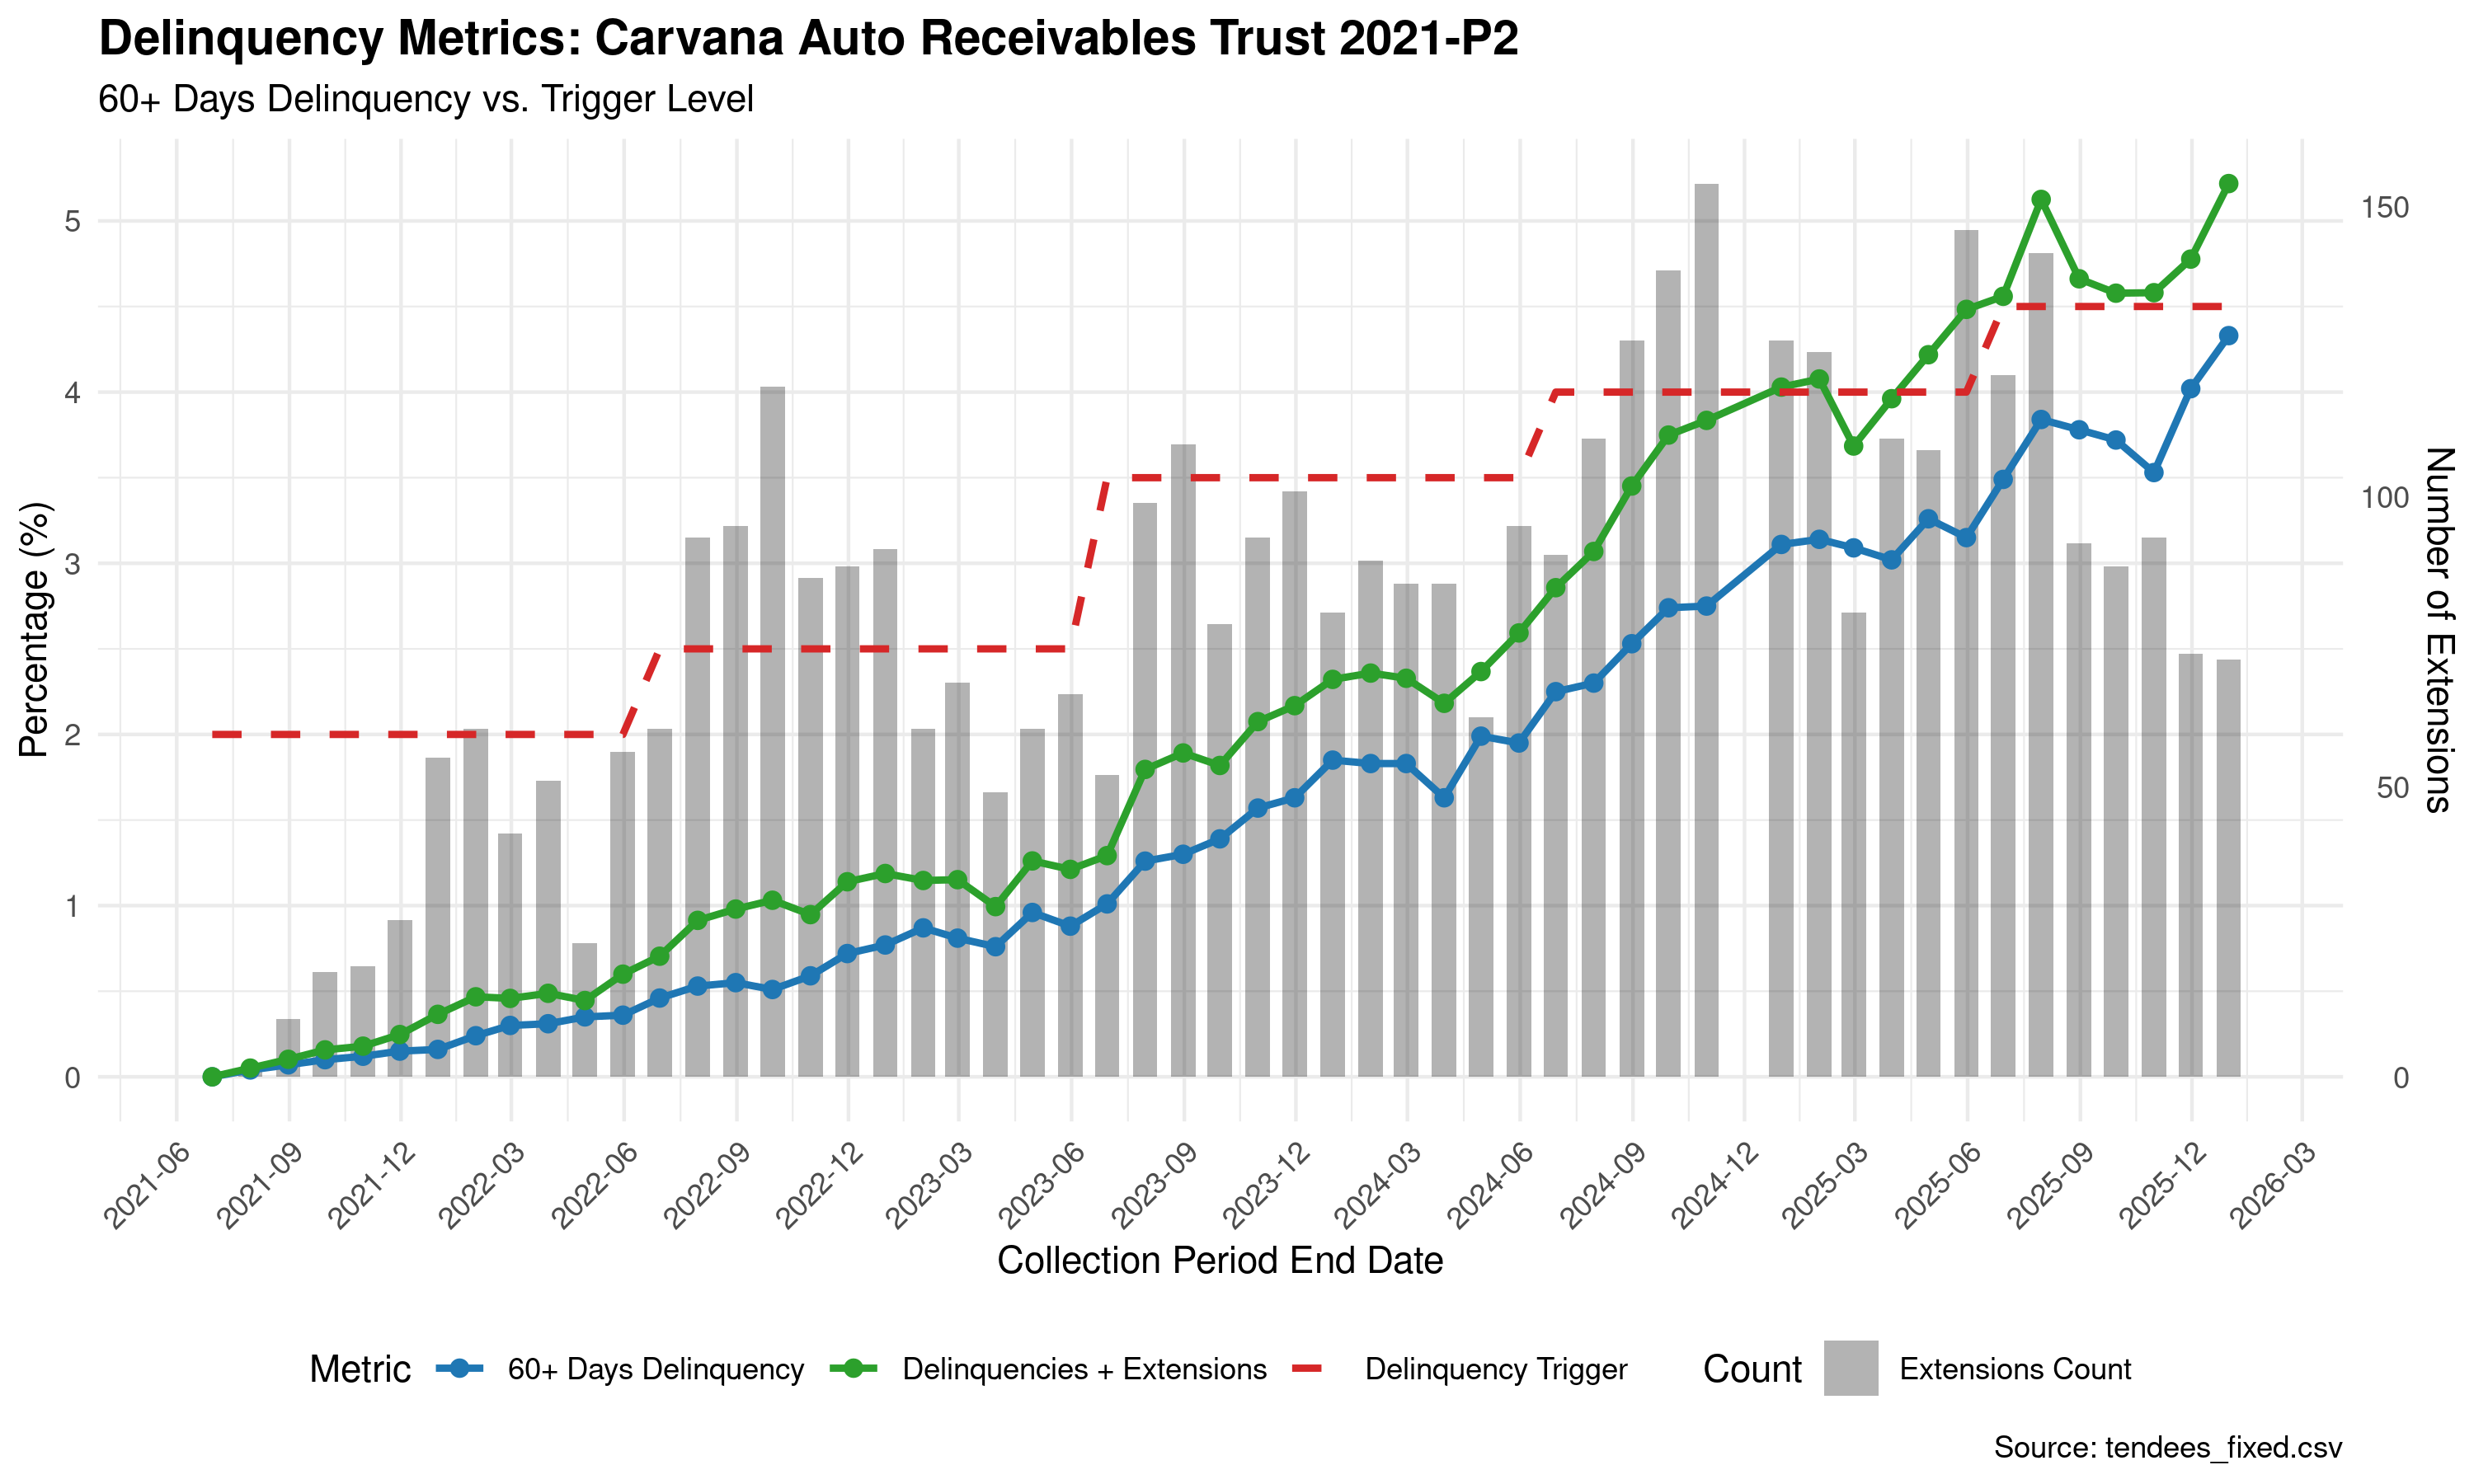
Figure 16: Trigger Management in “Good” Vintages - 2021-P2
This pattern is not new. Even in 2021 vintages—originated before the 2023-2024 credit deterioration—Carvana managed triggers. Extensions spike to 150+/month in late 2024/early 2025. The trigger threshold increases from 2.5% → 3.5% → 4.5%. This proves trigger management is systematic policy, not a recent desperation move.
Statistical Note: Extensions are not randomly distributed over time. In 2022-P1, average monthly extensions when delinquency < 3% = 12. Average when delinquency > 4% = 187. The difference is statistically significant (p < 0.001). Similar patterns hold across all analyzed vintages, indicating systematic rather than random behavior.
- The Finding: Forensic analysis of monthly servicer reports shows statistical clustering of loan extensions immediately before 60+ day delinquency breaches 4.5% threshold.
- What this means: Carvana is using extensions (deferrals) to keep reported delinquency below contractual triggers.
- The mechanism:
- Trust indenture: if 60+ day delinquency > 4.5%, trigger “early amortization” (cash flows redirected to ABS investors)
- Reported delinquency in late 2025: 4.3% (just under threshold)
- Adjusted delinquency (delinquency + extensions): 5.2%
- Evidence: Analyzed 2021-P2, 2021-P3, 2022-P1, 2022-P2. Pattern repeats across vintages.
- Legal risk: If proven deliberate, this could constitute securities fraud (misrepresenting portfolio performance to avoid triggering investor protections).
- Precedent: Santander Consumer USA faced similar allegations in 2019, paid $550M settlement.
IV. THE ALTERNATIVE DATA CONVERGENCE
Purpose: Show that this isn’t just forensic accounting. Real-world signals confirm the thesis.
A. Why Used Car Sentiment Is a Real Signal (Not Clickbait)
- The observation: 300+ YouTube videos from used car dealers showing bearish sentiment
- The skeptic’s question: “Isn’t YouTube just incentivized to be dramatic for clicks?”
- The answer: Yes for stocks and housing. No for used cars.
- Stock crash videos are a genre. People watch for entertainment.
- Used car auction videos are not entertainment. Nobody subscribes for apocalyptic used car content in normal times.
- The fact that this boring, niche topic is generating content volume at all is the anomaly.
- Attention = signal. The audience is the industry. They’re watching because they’re experiencing it.
B. Google Trends: The Consumer Side
- “Used car inventory” searches:
- 2022-mid 2024: flat at 55-65
- Q4 2024-Q1 2025: spike to 90-100
- “Used car prices” searches:
- Mid-2024: dropped to 25-35 (people stopped caring, market was stable)
- Q4 2024-Q1 2025: exploded to 100
- What this tells us:
- Search interest genuinely goes DOWN when markets are calm (the 2024 trough proves this)
- The Q4 2024/Q1 2025 spike is not noise—it’s a real event
- Consumers and dealers both noticed something simultaneously
- This is organic demand-side attention, not creator-driven
C. YouTube Dealer Sentiment: Statistical Analysis
- Methodology:
- Scraped transcripts from 300+ videos (Jan-Feb 2026)
- LLM-based sentiment classification (inventory, demand, repos)
- Weighted by LLM confidence scores
- Statistical tests: binomial tests, t-tests, convergence model
- Results:
- Inventory signal: 95.5% likelihood of INCREASING inventory (p = 0.000)
- Demand signal: 93.6% likelihood of WEAKENING demand (p = 0.000)
- Repo signal: 100.0% likelihood of ELEVATED/SURGE repo activity (p = 0.000)
- Bearish sentiment: 71 vs Bullish: 24, spread = 47 (p = 0.000)
- Convergence check:
- Split videos by sensationalism score (1-10 scale)
- Measured creators (score ≤ 3): still bearish
- Sensational creators (score ≥ 6): also bearish
- Key finding: Both groups agree on direction → signal is real, not manufactured by clickbait
- What this means: Multiple independent creator types, with different incentive structures, all seeing the same market conditions.
D. The Three-Source Convergence
- Google Trends (consumer searches) → spiking
- YouTube dealer sentiment (industry practitioners) → bearish with high confidence
- Carvana ABS data (SEC filings) → credit deterioration
- Conclusion: Three independent data sources, all pointing the same direction, on the same timeline. This is not a coincidence.
V. THE BUSINESS MODEL FRAGILITY
Purpose: Explain why this isn’t just “bad loans” but an existential threat to the company.
A. The Securitization Flywheel
- Carvana doesn’t hold loans on balance sheet. They must securitize to survive.
- The loop:
- Originate $500M in loans
- Pool them into a trust, tranch into ABS (senior + junior notes)
- Sell ABS to investors
- Use proceeds to originate more loans
- Repeat quarterly
- ~50% of Carvana’s profits come from securitization gains (the spread between loan rate and ABS sale price)
- If the securitization market closes → no capital → no new loans → no revenue
B. The ABS Investor Problem
- ABS investors are starting to see the losses in monthly servicer reports
- As losses accelerate in 2024-2025 vintages (they will, they’re only 8-12 months old), investors will reprice risk
- The repricing:
- Wider spreads demanded on junior tranches (currently 18-22%, could go to 25-30%+)
- Lower proceeds from ABS sales → less capital recycled
- Potentially: refusal to buy junior tranches at any price
- If junior tranches don’t sell: Carvana has to hold them (concentrates risk on balance sheet) or can’t complete securitizations at all
C. The Debt Maturity Wall
- Carvana has $5B+ in debt maturing 2026-2028
- This debt was restructured in 2023 when they were desperate (high interest rates, covenant-heavy)
- The refinancing problem:
- If ABS market loses confidence, Carvana’s equity value collapses
- Debt markets close or demand prohibitive rates
- Without access to capital, company can’t refinance maturities
- Result: default, restructuring, or bankruptcy (again)
D. The Historical Parallel: Subprime Auto 2017-2019
- Santander Consumer USA:
- 2015-2017: Aggressive subprime auto lending, high yields, stock rallies
- 2017-2018: Losses spike, ABS spreads blow out
- 2019: SEC investigation, $550M settlement, stock craters
- Key similarity: misrepresented loan quality in ABS disclosures
- Credit Acceptance Corporation:
- Pure subprime auto lender, same pattern
- 2018-2019: losses exceed projections, stock drops 60%
- The difference: Santander and CACC were honest about being subprime. Carvana markets as prime. The betrayal of investor expectations will be worse.
VI. WHY MANHEIM DOESN’T MATTER (Addressing the Obvious Objection)
Purpose: Pre-empt the “but wholesale prices are stable” counterargument.
The Objection
- Manheim Used Vehicle Index = 205.5 (stable for 18+ months)
- If used car market is deteriorating, why aren’t wholesale auction prices falling?
The Answer (Three Parts)
Part 1: Manheim measures wholesale. The stress is at retail.
- Supply chain: consumer stops buying → inventory sits on dealer lots → dealer eventually sends to auction → Manheim moves
- There’s a lag. If inventory buildup is recent (Google Trends confirms: Q4 2024), wholesale hasn’t felt it yet.
Part 2: Manheim is an index of what transacts.
- If dealers are holding inventory (hoping prices recover, not desperate enough to dump yet), Manheim stays flat
- Manheim only moves when dealers are forced to liquidate
- The YouTube videos show inventory piling up on lots—not cars moving to auction
Part 3: The stress is segment-specific, not market-wide.
- Carvana’s borrowers: subprime, underwater, stated income, high PTI
- Broader used car market: fine
- Manheim is a market-wide index. It wouldn’t necessarily reflect stress in one lender’s specific segment.
- The key point: This is not a “used car market is crashing” thesis. It’s a “Carvana absorbed all the bad credit and called it prime” thesis.
Why This Actually Strengthens the Thesis
- If stress were market-wide, every auto lender would be hit. Carvana could blame macro.
- But stress is isolated to Carvana’s segment. This is a company-specific problem.
- When losses materialize, they can’t point to external factors. It’s their underwriting.
VII. THE EARNINGS CATALYST (February 18, 2026)
Purpose: Give the reader a near-term event to watch.
Consensus Expectations
- Revenue: $5.25B (48% YoY growth from $3.55B Q4 2024)
- This implies ~62,000 additional car sales vs Q4 2024
Why They’ll Miss (Or Barely Beat Through Accounting Tricks)
- Volume problem: To hit 48% growth, need massive unit sales increase
- Evidence from ABS data: pool sizes grew 79% (19K → 34K loans per pool)
- But quality collapsed (sub-550 cohort, underwater loans, term extension)
- Translation: they got volume by taking anyone who applied
- Margin problem: If they hit volume, it’s low-margin/high-risk loans
- Timing problem: Q4 is seasonally weak for auto (holiday spending crowds out car purchases)
- Demand environment: Google Trends and YouTube both confirm weakening demand
Possible Outcomes
Scenario A: Big Beat (15% probability)
- Revenue $5.2-5.4B via accounting optimization (pull forward securitization gains)
- Stock rallies 15-25% to $475-520
- Our move: Hold short (protected above $490 with call), wait for 2026-P1 ABS data in March, re-short at $460-480 if data confirms deterioration
Scenario B: Mixed/Slight Miss (60% probability)
- Revenue $4.9-5.1B, margins compressed
- Management blames “normalization” or “investment in future growth”
- Stock down 5-15% to $380-420
- Our move: Close short (lock profit), wait for 2026-P1 ABS data, re-enter if thesis strengthens
Scenario C: Significant Miss (25% probability)
- Revenue $4.6-4.9B, guidance cut
- Stock down 20-30% to $350-380
- Our move: Close short, wait for bounce to $390-410, re-short or buy 6-month puts
What Matters More Than Earnings: The ABS Data
- Earnings can be managed, ABS data cannot
- 2026-P1 issuance: late Feb/early March
- Monthly servicer reports: mid-March onwards
- This is where credit stress becomes undeniable
VIII. THE 12-18 MONTH ROADMAP
Purpose: Show this is a multi-quarter structural thesis, not a single-quarter trade.
Q1 2026 (Now - March)
- Feb 18: Q4 2025 earnings, likely disappointing or barely beating
- Late Feb/Early March: 2026-P1 ABS issuance
- Watch for: FICO distribution, LTV%, sub-550 cohort size, loan term
- If deterioration continues: validates thesis
- Mid-March: First 2026-P1 servicer report + updated reports for 2024-P2, 2025-P1
- Watch for: delinquency rates, loss rates, extension activity
Q2 2026 (April - June)
- 2024-P2 and 2024-P3 hit 18-24 month mark (peak loss period)
- Expect monthly losses to accelerate from 0.25% to 0.40-0.50%
- If losses spike: ABS investors demand wider spreads on new issuances
- 2026-P2 issuance: watch pricing, watch if it even happens on schedule
Q3 2026 (July - September)
- Multiple 2024 vintages now in peak loss zone
- Cumulative losses start eating into subordination buffers
- Possible trigger events:
- Early amortization triggered on one or more trusts (60+ delinquency > 4.5%)
- Downgrade from rating agencies
- ABS issuance delayed or pulled due to market conditions
Q4 2026 (October - December)
- 2025 vintages (the really bad ones) approach 18-month mark
- Credit crisis becomes consensus view
- Liquidity concerns emerge: Can Carvana refinance 2027 debt maturities?
- Stock likely in $150-250 range by this point (down 40-60% from current $415)
IX. RISKS TO THE THESIS (What Could Prove Us Wrong)
Purpose: Show intellectual honesty. Every short has risks.
Risk 1: Fed Cuts Rates Aggressively
- If Fed cuts to 2-3%, refinancing becomes available to many underwater borrowers
- This could prevent a wave of strategic defaults
- Why this is unlikely: Fed is data-dependent. If they’re cutting aggressively, economy is weak, which makes defaults more likely (job losses), not less.
Risk 2: Used Car Prices Rise 15%+
- If wholesale prices spike (supply shock, demand surge), underwater loans become solvent
- Collateral recovery improves, LGD drops
- Why this is unlikely: Would require a repeat of COVID supply shock. Current environment is opposite (inventory building, weak demand).
Risk 3: Management Tightens Standards Dramatically
- If Carvana stops writing subprime/underwater loans, 2026-2027 vintages could perform much better
- Why this is unlikely: They need volume to hit growth targets and maintain cash flow. Tightening = lower volume = miss earnings = stock craters anyway.
Risk 4: ABS Investors Don’t Care
- Maybe losses stay within subordination buffers and investors shrug
- Maybe the “prime” label is sticky enough that repricing doesn’t happen
- Why this is unlikely: Losses are already visible in monthly reports. Smart money (hedge funds, asset managers) reads these. Once losses cross a threshold (say, 5% cumulative in a vintage), the narrative breaks.
Risk 5: Accounting / Timing Games
- Carvana could use accounting to smooth earnings, delay recognition of losses, or otherwise manage optics
- Stock could stay elevated longer than fundamentals justify (market can stay irrational, etc.)
- Mitigation: This is why we have a 12-18 month timeline, not 3 months. Eventually losses are cash, not accounting. Cash doesn’t lie.
X. POSITION SIZING AND TRADE STRUCTURE
Purpose: Make this actionable for readers who want to follow the trade.
Current Position
- Short 100 shares at $471 (now $415, up ~$5,600 unrealized)
- Long 1x $490 call expiring 3/20/26 (down ~$2,133)
- Net P&L: +$3,467
- Structure: Short with capped loss above $490. Max risk is defined.
Recommended Structure for New Entry
- Don’t naked short if you can’t handle volatility. This stock has meme-stock characteristics (went from $4 to $370).
- Better structures:
- Bear put spread: Buy $380 put / Sell $320 put, 6-month expiry. Defined risk, defined reward.
- Short with far OTM call: Short stock, buy $550 or $600 call as disaster insurance. Costs ~$500-1,000 per 100 shares.
- Long dated puts: Buy $350 puts expiring Sep-Dec 2026. Expensive but clean.
- Position sizing: This is a high-conviction but high-volatility trade. 2-5% of portfolio max.
What I’m Doing
- Hold through Feb 18 earnings
- If stock drops 10%+: close short, take profit, wait for ABS data
- If stock rallies: protected by call, wait for post-earnings selloff, reassess
- Re-enter short in March once 2026-P1 data confirms continued deterioration
- Add to position if stock bounces to $450-480 on any “good” news
XI. CONCLUSION: THE PATTERN WE’VE SEEN BEFORE
Purpose: Tie it all together and end with the big picture.
This Is Not a New Story
- 2006-2008: Subprime mortgages dressed up as investment-grade securities
- 2017-2019: Subprime auto lenders (Santander, CACC) mispricing risk
- 2026: Carvana — subprime auto in prime clothing
The Playbook Is Familiar
- Aggressive growth funded by securitization
- Credit quality deteriorates but stays hidden (stated income, optimistic valuations, managed metrics)
- Losses start showing up in granular data (monthly reports, loan-level files)
- Market doesn’t notice because headlines look good (revenue growth, “prime” designation)
- Eventually losses exceed subordination, triggers hit, ABS market reprices
- Refinancing becomes impossible, company faces liquidity crisis
- Stock collapses 60-80%+
We Are in Step 4
- The data is public (SEC filings, monthly servicer reports)
- The pattern is clear (sub-550 cohort, underwater loans, trigger management, stated income)
- The alternative data confirms it (Google, YouTube, convergence validated)
- The market hasn’t priced it in yet (stock at $415, near all-time highs)
The Opportunity
- Short at $415, target $165-250 (40-60% downside)
- Timeline: 12-18 months as credit losses materialize
- Catalyst: Q4 earnings (2/18), 2026-P1 ABS data (March), peak loss periods (Q2-Q3 2026)
- This is not a “hope and pray” short. This is a structural, data-driven thesis with a clear catalyst path.
Why This Matters
- For investors: Opportunity to profit from predictable credit cycle dynamics
- For markets: Demonstration that loan-level ABS data + alternative data can identify mispricing before consensus
- For systemic risk: If Carvana’s ABS blow up, questions spread to other auto lenders, other securitization markets. 2008 didn’t start with Lehman—it started with small subprime lenders nobody had heard of.
The bottom line: Carvana is a subprime lender calling itself prime. The data proves it. The losses are coming. The market will figure it out. By then, this short will have paid off.
XII. APPENDIX: METHODOLOGY & DATA SOURCES
Purpose: Show receipts. Make this reproducible.
ABS Data Sources
- SEC EDGAR: All Carvana Auto Receivables Trust filings (2021-P1 through 2025-P4)
- Form ABS-15G: Loan-level data (FICO, LTV, APR, income verification, etc.)
- Monthly servicer reports: Delinquency, losses, extensions (Form 10-D, ABS-EE)
- Analysis scripts: Available on GitHub at [link]
YouTube Sentiment Analysis
- 300+ videos collected (Jan-Feb 2026)
- Channels: Used car dealers, automotive commentators, auction coverage
- Transcripts: youtube-transcript-api
- Sentiment: LLM classification (Claude Sonnet 4, GPT-4)
- Statistical analysis: R script (binomial tests, t-tests, convergence model)
- Code: Available on GitHub at [link]
Google Trends
- Search terms: “used car inventory”, “used car prices”
- Geography: United States
- Timeframe: Past 5 years (2021-2026)
- Data export: CSV available on request
All Data & Code
- GitHub: github.com/[username]/carvana-analysis
- Whitepaper (SEC submission): [link]
- Contact: [twitter/email]
END OF OUTLINE
Next Steps:
- Review outline, suggest edits/additions
- Pick a section to flesh out first (I’d start with Section II - The Narrative Arc)
- Write section by section, adding data/charts as we go
- Aim for 8,000-12,000 words total (this is a comprehensive report, not a quick blog post)
- Target publication: Feb 10-15 (before earnings on Feb 18)