The Quiet Run
Eight Funds. Four Sponsors. One Pattern.
I. EXECUTIVE SUMMARY
On March 3, 2026, Blackstone Private Credit Fund — the largest non-traded private credit vehicle in the world, with $82B in assets under management — reported its first-ever net outflows — more money redeemed than raised. $3.7 billion walked out the door. $2 billion walked in. The difference — $1.7 billion — represents something that has never happened before in the fund’s history.
There was no CNBC alert. No ticker flashing red. No trading halt. BCRED is not exchange-traded. Its investors cannot sell on the open market. They can only request redemption once per quarter, subject to a 5% cap that the board can — and now must — override. Blackstone upsized to 7%. It was not enough.
This is what a bank run looks like when there is no bank.
We built a systematic parser for SEC EDGAR SC TO-I/A filings — the tender offer statements that non-traded credit funds are required to file when they repurchase investor shares.1 We track 8 non-traded vehicles across 4 sponsors — Blackstone, Blue Owl, Apollo, and Ares — normalizing for fund size to isolate genuine changes in exit demand from Assets Under Management (AUM) amplification. The pattern is unambiguous. BCRED’s fill rate tripled from ~30% to 91%, then breached to 7%. Apollo Debt Solutions went from 15% to 97%. Blue Owl halted redemptions entirely at one fund. Ares Strategic Income Fund saw a 161x increase in dollar redemptions over six quarters. Four independent sponsors. Same trajectory. Same timing. This is not idiosyncratic. It is systemic.
The collateral is failing. The primary borrowers in these portfolios are mid-market software and technology companies — and the sector is in structural decline. The iShares Expanded Tech-Software Sector ETF (IGV) is down -23% from its December peak. The first defaults — First Brands Group and Tricolor Holdings — have already arrived.2 And the cause is not cyclical. The same alternative asset managers funding private credit are simultaneously funding the AI infrastructure buildout that is displacing the SaaS companies sitting in their loan portfolios. The sponsors are funding the disruption of their own collateral.
The psychology makes it worse. These are non-traded, gated vehicles with no market price. When stress appears, there is no price signal to tell investors the panic is overdone — no mechanism for the market to say the assets are fine, stop selling. There is only a 5% quarterly cap and a first-mover advantage: redeem now, or risk being gated. The rational choice for each individual investor is the destructive choice for the system. The acceleration from 30% to 91% at BCRED is not a rational reassessment of credit quality — Net Asset Value (NAV) only moved -2.8%. It is a psychological cascade, the reflexive core of every bank run in history, running through a structure with no circuit breaker.
The macro environment has sealed the trap. The US is in a shooting war with Iran. The Strait of Hormuz is disrupted. Oil has spiked from $78 to $99 (+27%). Producer Price Index (PPI) services came in at +0.8% MoM. Core Personal Consumption Expenditures (PCE) is running at 3.2% YoY. Unemployment has crept from 3.7% to 4.3%. The Fed is frozen — too much inflation to cut, too much weakness to hike. In every prior credit cycle, rate cuts were the release valve. This time, the valve is welded shut.
The contagion channels are already active. Private credit stress feeds into software defaults, which feed into subprime auto deterioration — Carvana’s CFO and COO sold stock on the same day — which connects to consumer fintech, which connects to bank exposure to shadow banking. The last time America saw stress in an opaque, illiquid corner of the financial system — dismissed as contained, spreading through channels the market was not watching — was 2008. We are not saying this is 2008. We are saying the architecture is the same, and the release valve that existed then — an aggressive Fed — does not exist now.
The private credit stress started as a liquidity crisis — Blue Owl sold loans at 99.7 cents on the dollar, meaning the loans themselves were fine. But the collateral deterioration, the reflexive psychology, and the macro trap are now creating the conditions for it to become a credit crisis. That distinction — liquidity or credit — is the single most important question in markets right now, and every variable we track is moving toward the worse answer.
The primary trade expression is a pair: long HLNE (Hamilton Lane) / short OWL (Blue Owl Capital). Both are classified as “private credit” by the market, but they are fundamentally different businesses with opposite exposure to the same catalyst. OWL is an asset manager whose fee income evaporates as non-traded AUM shrinks — its stock has round-tripped from $10 to $27 and back to $10, erasing the entire private credit boom. HLNE is a fixed-fee advisory firm whose revenue increases when clients need help navigating a crisis — its entire C-suite bought $4.2M in open-market stock in February. OWL’s insiders bought nothing.
We know how serious this sounds. We are not making the claim lightly. What follows is the evidence — 8 public filing streams, 4 sponsors’ redemption data, a macro environment that has eliminated the exit ramp, and a contagion map that is already lighting up. The filings are public. The math is simple. The reader should evaluate the evidence and draw their own conclusions.
II. THE PRIVATE CREDIT BOOM — AND ITS STRUCTURAL FLAW
What Private Credit Is
Private credit is direct lending by non-bank institutions — funds that originate and hold loans to companies, bypassing the traditional bank syndication market. Instead of a company borrowing from JPMorgan and JPMorgan selling pieces to other banks, a private credit fund like Blackstone’s BCRED or Apollo’s ADS lends directly, holds the loan, and collects the interest. The loans are typically floating-rate, senior secured, first-lien — the safest slice of a borrower’s capital structure. The borrowers are mostly mid-market companies, many of them private software and technology firms backed by private equity sponsors.
This market barely existed a decade ago. In 2014, total private credit AUM was roughly $500 billion. By the end of 2025, it exceeded $2 trillion.3 The growth was driven by a simple pitch: yields of 10-12% in a zero-rate world, with lower volatility than public bonds because the loans are not marked to market daily. Pension funds, sovereign wealth funds, endowments, and — critically — retail investors poured capital in. The four largest sponsors built empires on it:
| Sponsor | Flagship Non-Traded Vehicle | Approximate AUM | Founded |
|---|---|---|---|
| Blackstone | BCRED | ~$82B | 2021 |
| Blue Owl | OCIC, OTIC, OBDC2 | ~$25B combined | 2021 |
| Apollo | ADS | ~$14B | 2022 |
| Ares | APMF, ASIF | ~$8B combined | 2022-2023 |
Why the Structure Matters
These are not hedge funds. They are not exchange-traded. An investor in BCRED cannot log into a brokerage and sell. The funds are structured as non-traded closed-end vehicles — investors buy in through periodic offerings and can only exit through quarterly tender offers, subject to a 5% cap on total shares repurchased per quarter. The board can choose to accept more than 5%, but it is not obligated to. If more than 5% of investors want out, someone gets told no.
This structure was designed for a world where exit demand is low and steady — 1-2% per quarter, normal portfolio rebalancing, nothing that tests the cap. It works beautifully in calm markets. In stressed markets, it creates an inherent fragility: the fund holds illiquid loans that take weeks or months to sell, but promises investors quarterly liquidity on a fixed schedule. The mismatch between the asset (illiquid) and the liability (quarterly redemption promise) is the same structural vulnerability that has blown up money market funds, mortgage REITs, and open-ended property funds in prior cycles.
The difference is that this time, the vehicles are much larger, the retail investor base is much broader, and the Fed cannot intervene.
The Players
Blackstone (BX) is the largest alternative asset manager in the world. BCRED is its crown jewel in private credit — $82B in AUM, the single largest non-traded credit fund ever assembled. Blackstone’s brand is the reason retail investors trusted the product. That brand is now being tested.
Blue Owl Capital (OWL) is a pure-play alternative asset manager built almost entirely around the private credit boom. It runs three non-traded vehicles — OCIC, OTIC, and OBDC2 — and a publicly traded Business Development Company (BDC), OTF. OWL’s stock went from $10 to $27 during the boom and is now back to $10. The entire rally has been erased.
Apollo Global Management runs ADS (Apollo Debt Solutions), which grew from near-zero to $14B in under three years. Apollo is more diversified than Blue Owl, but ADS is approaching the same stress point.
Ares Management runs APMF and ASIF, both showing extreme acceleration in redemptions from smaller bases. Ares also manages ARCC, the largest publicly traded BDC — a distinction that will matter enormously as this story unfolds.
The Question Nobody Was Asking
For four years, the pitch worked. Yields were high, defaults were low, NAVs were stable, and redemption rates stayed well below the 5% cap. The question nobody was asking — because nobody needed to — was: what happens when everyone wants out at once?
We built a tool to find out.
III. THE EVIDENCE
Every quarter, these non-traded funds file a Schedule TO (SC TO-I) with the SEC when they offer to repurchase investor shares. The final amendment discloses the results: shares tendered, shares accepted, NAV per share, total purchase price, and whether the board upsized beyond the standard 5% cap.4 We parsed every SC TO-I/A filing across all 8 vehicles going back to 2023.
Raw dollar redemptions are misleading — they scale with fund size. A fund that doubles its AUM doubles dollar redemptions at a constant exit rate. So we normalize: fill rate = shares tendered / shares offered (where shares offered = 5% of outstanding). A fill rate of 100% means demand exactly hits the cap. Above 100%, the board must upsize, gate, or reject. Acceleration in fill rate cannot be explained by fund growth. It is genuine increase in exit demand.
Here is what the filings show.
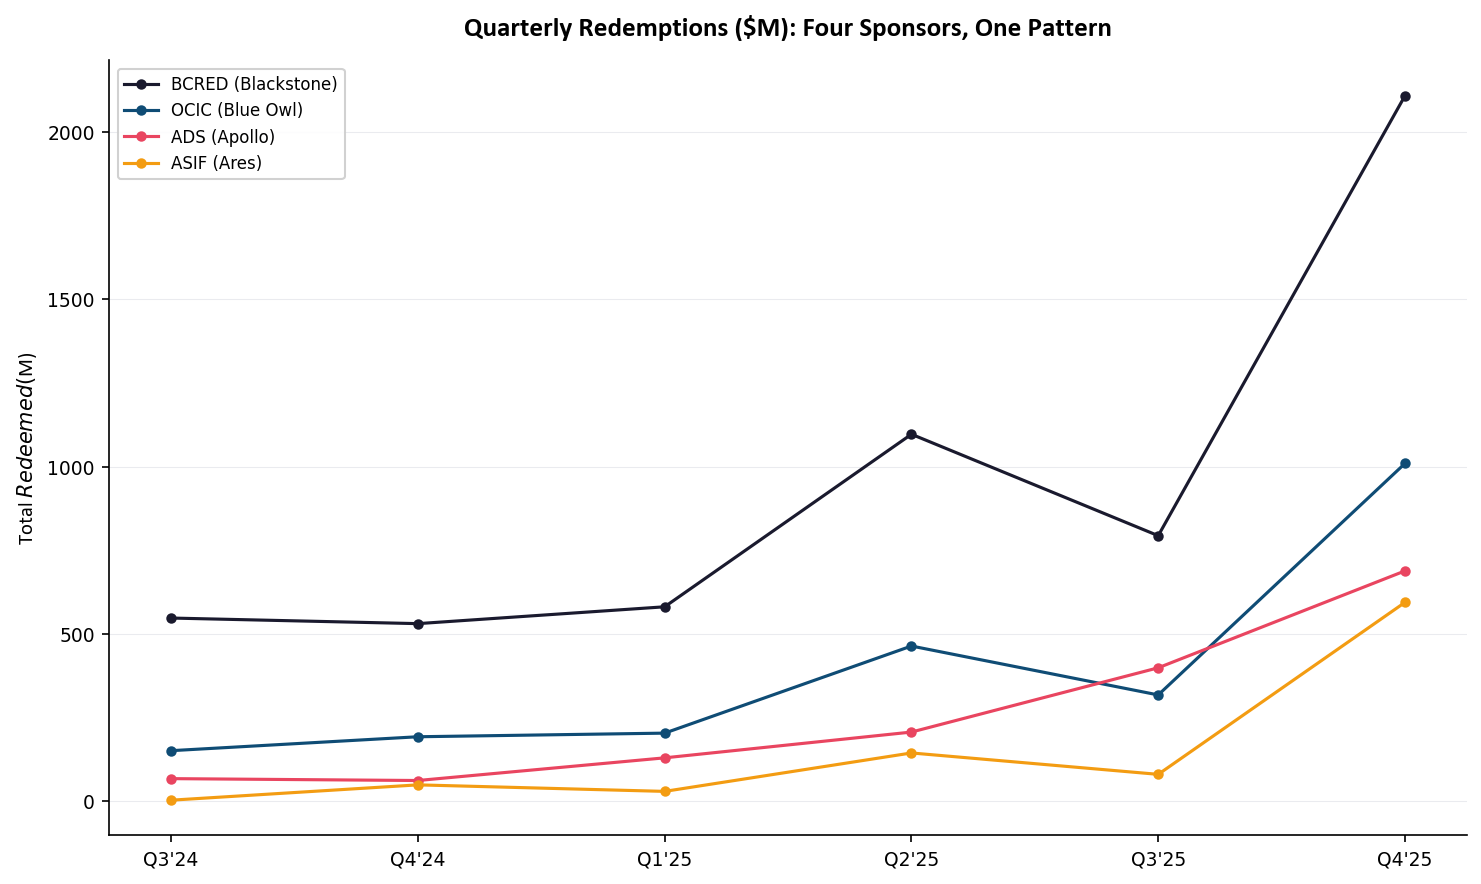
Quarterly dollar redemptions for the four largest non-traded private credit vehicles, Q3 2024 through Q4 2025. Every line goes vertical simultaneously. BCRED’s Q1 2026 data ($3.7B) is not shown — it would extend the Blackstone line off the top of the chart. Source: SEC EDGAR SC TO-I/A filings.
BCRED (Blackstone Private Credit Fund) — the largest non-traded private credit fund in the world. The fill rate held steady at ~30% through Q1'25 — normal churn, ~1.5% of the fund redeeming per quarter. Then it broke. Q4'25 hit 91% fill — three times the baseline, approaching the cap. Q1'26 blew through it. Blackstone upsized from 5% to 7%, accepted $3.7B in redemptions, took in only $2B in new capital, and recorded its first-ever net outflows: $1.7B out the door. Employee redemptions added another 0.9%. NAV per share has declined in every quarter tracked: $25.50 → $24.79 (-2.8%), a persistent, unidirectional slide that shows no sign of stabilizing.
Pause on this. The largest private credit fund in the world — the flagship of the largest alternative asset manager on Earth — just lost more money to redemptions than it raised in new capital. For the first time in its history.
ADS (Apollo Debt Solutions BDC) — the clearest hockey-stick pattern in the dataset. The baseline (Q2'24 through Q4'24) was ~17% fill, ~0.8% redemption rate. By Q4'25, ADS hit 97% fill — six times the baseline, essentially at the 5% cap. Five consecutive quarters of acceleration: 0.77% → 1.38% → 1.83% → 3.05% → 4.85%. There is no quarter where the rate declined. NAV: $24.90 → $24.40 (-2.2%), the same persistent decline as BCRED. If ADS breaches 100% in Q1'26 — which the trajectory makes likely — Apollo’s board will face the same choice Blackstone just made: upsize, gate, or reject.
OCIC (Blue Owl Credit Income Corp) — a 5.3x increase in quarterly redemptions from Q1'25 ($204M) to Q4'25 ($1.01B). The board accepted all tenders despite exceeding the cap. Blue Owl simultaneously sold $1.4B in assets at 99.7 cents on the dollar and halted redemptions at a separate private retail debt fund — the worst-case outcome for investor confidence.5
OTIC (Blue Owl Technology Income Corp) — the board tripled the redemption cap to 15.4% of outstanding shares, accepting $527M in Q4'25. You do not upsize to three times the standard cap for normal churn. You do it when the alternative — gating investors — would trigger an even worse panic.
ASIF (Ares Strategic Income Fund) — a 161x increase from Q3'24 ($3.7M) to Q4'25 ($594.6M). The most extreme acceleration of any entity in the dataset on a percentage basis.
OBDC2 (Blue Owl Capital Corp II) runs monthly tenders at $30-60M per month, with multiple months exceeding the cap. APMF (Ares Private Markets Fund) went from $0.4M to $72M — acceleration from a small base. AS3 (Apollo S3) remains immaterial.
Blackstone, Blue Owl, Apollo, and Ares do not share investors, portfolio managers, or investment committees. Their borrower bases overlap only partially. They operate independently and compete for the same capital. The only thing they share is a structural feature — illiquid assets funded by quarterly liquidity promises — and a macro environment that is making investors question whether those promises can be kept.
When four independent sponsors show the same pattern simultaneously, the explanation is not idiosyncratic. It is systemic.
IV. THE COLLATERAL PROBLEM
The redemption data tells you investors want out. It does not tell you why. For that, look at what these funds actually own.
The primary borrowers in non-traded private credit portfolios are mid-market software and technology companies — SaaS platforms, vertical software, cloud infrastructure businesses. Many are private equity-backed, leveraged at 5-7x EBITDA, floating-rate, senior secured. On paper, the safest slice of the capital structure. In practice, the collateral is a bet on software earnings growth — and that bet is going wrong.
The iShares Expanded Tech-Software Sector ETF (IGV) — the closest public proxy for the private software companies sitting inside these BDC portfolios — is down -23% from its December peak, falling from $109 to $84.6 Public SaaS multiples are compressing across the board. Revenue growth is decelerating. And the reason is not cyclical — it is structural.
The AI disruption paradox. The same alternative asset managers funding private credit are simultaneously funding the AI infrastructure buildout — hyperscaler capex, GPU clusters, foundation model training. That AI buildout is producing tools that directly displace the mid-market SaaS companies sitting in their loan portfolios. Copilots replace workflow automation. Foundation models replace vertical AI startups. AI-native platforms replace legacy SaaS at a fraction of the seat cost. The sponsors are funding the disruption of their own collateral.
This is not theoretical. First Brands Group and Tricolor Holdings — both private credit borrowers in BDC portfolios — filed for restructuring in late 2025 and early 2026.2 They are the first names. The software sector’s -23% drawdown suggests they will not be the last.
The loan-level data still looks fine on the surface. Blue Owl sold $1.4B in assets at 99.7 cents on the dollar — the loans themselves were performing at the time of sale. NAV declines across the funds have been modest: -2% to -3% over six quarters. But this is the nature of private credit marks — they lag. These loans are not marked to market daily. They are marked quarterly by the fund’s own valuation committees, using models that reflect the credit environment of the previous quarter, not the current one. By the time the marks catch up to a -23% decline in public software and an oil shock squeezing borrower margins, the damage is already done.
The Psychology Problem
That is the collateral problem — the math. But math is only half of what makes a credit crisis. The other half is worse.
Consider an investor in BCRED. She reads that Blue Owl has gated a fund. She sees the IGV chart. She notices the oil shock. None of this directly impairs her investment — BCRED’s loans are still performing, the NAV is down only -2.8%, and Blackstone’s brand is behind the product. But she also knows there is a 5% quarterly cap on redemptions. She knows that if too many people request their money back, someone gets told no. And she knows that the people who request early get served first.
So she redeems. Not because she thinks the loans are bad. Because she thinks other people might think the loans are bad — and she does not want to be the one stuck behind a gate.
This is the reflexive core of every bank run in history. The act of protecting yourself against a liquidity crisis creates the liquidity crisis. Every investor who redeems “just to be safe” pushes the fill rate closer to the cap, which makes the next investor more likely to redeem, which pushes the fill rate higher still. The fear is the contagion. The 5% cap — designed to protect the fund — becomes the very mechanism that accelerates the panic, because it creates a first-mover advantage. If you wait, you might get gated. If you act now, you get your money. The rational choice for each individual investor is the destructive choice for the system.
And here is what makes private credit uniquely vulnerable to this dynamic: there is no price signal to restore equilibrium. In a public market, panic selling drives the price down until it becomes attractive enough for buyers to step in. The price is the circuit breaker. In a non-traded fund, there is no price. NAV is set quarterly by a committee. The investor cannot see whether the fund is cheap or expensive — she can only see headlines, fill rates, and the gate getting closer. There is no mechanism for the market to tell her “the panic is overdone, the assets are fine, stop selling.” The only signal she gets is the one that makes her want to sell more.
This is why the fill rate data is so alarming. The acceleration from 30% to 91% at BCRED is not a rational reassessment of credit quality — NAV only moved -2.8%. It is a psychological cascade. Investors are not running because the house is on fire. They are running because they see other people running, and the exits are narrow.
The collateral is weakening. The psychology is accelerating. The question is no longer whether private credit is under stress — the filings have settled that. The question is how far it goes.
V. THE SCENARIO FRAMEWORK
We frame the private credit stress through two scenarios and track positive confirmations for each.
Scenario 1 — Temporary Squeeze
Redemptions peaked in Q4'25 due to year-end liquidity needs and media amplification. Q1'26 fill rates retreat to <50%. NAVs stabilize. No new defaults. Funds that upsized (OTIC, OCIC) return to normal 5% caps. Recovery in 2-3 quarters.
Scenario 2 — Fundamental Cracks
Redemption pressure continues accelerating. Fill rates breach 100% at BCRED and ADS, forcing upsize/gate decisions. Software/SaaS defaults spread beyond First Brands and Tricolor. Secondary loan prices drop below 95 cents. Bank credit lines to non-traded vehicles tighten. Multi-year unwind.
Current Read: Scenario 2 Is Gaining Probability
For Scenario 1 to work, ALL of the following must be true:
- The Fed signals rate cuts within
2quarters - Oil falls back below
$80and the Iran conflict de-escalates - The software sector stabilizes (IGV stops making new lows)
- New capital inflows to non-traded vehicles resume and net flows turn positive
- No new material defaults after First Brands and Tricolor
- Blue Owl lifts its redemption gate
How many of those are currently on track? Zero. Every single one is moving in the wrong direction.
The BCRED Q1'26 filing — released today, March 3, 2026 — is the strongest evidence yet for Scenario 2. Blackstone upsized from 5% to 7%. First-ever net outflows. Blue Owl has already gated. The cap is binding. And the macro environment that would need to ease for this to resolve is getting worse, not better.
VI. THE MACRO TRAP
The Fed’s Impossible Position
| Indicator | Value | Implication |
|---|---|---|
| Consumer Price Index, CPI (Jan 2026) | 2.4% YoY headline | Looks manageable — but this is BEFORE the oil shock |
| PPI Services (Jan 2026) | +0.8% MoM | Hot — services inflation is sticky and feeds directly into PCE |
| Core PCE (Jan 2026) | 3.2% YoY | Well above 2% target — the number the Fed actually watches |
| Unemployment | 4.3% (Jan 2026) | Up from 3.7% a year ago, rising steadily |
| Oil (WTI) | $78 → $99 (+27%) | Strait of Hormuz disruption — not yet priced into CPI |
| Gasoline (BLS, SA) | -7.5% YoY in Jan | The easy comp. Feb/March readings will reverse hard with $95+ oil |
| 10-Year Treasury | Under 4% | Flight to safety — but real rates near zero with 2.9% PCE |
The January BLS tapes look deceptively calm: headline CPI at 2.4%, gasoline still negative year-over-year. But that is backward-looking data from before the oil shock hit. PPI services at +0.8% MoM is the leading indicator — that flows straight into the next PCE print.7 And with oil up 27% since December, the February and March CPI readings will be ugly.
The Fed cannot cut. Core PCE at 3.2%, an oil shock about to push headline higher — cutting would be a 1970s-level policy error. The Fed cannot hike. Unemployment rising, private credit blowing up, the BDC exchange-traded fund (ETF) down -14%, the software sector down -23% — hiking would accelerate the credit unwind.
The put is off. In 2020, the Fed could flood the system with liquidity because inflation was dormant. In 2026, inflation constraints mean the Fed is a spectator to whatever unfolds in credit markets. This is the critical difference between a temporary squeeze and fundamental cracks. A temporary squeeze resolves when conditions ease — rate cuts, stabilized spreads, renewed confidence. If the Fed cannot ease, the squeeze has no natural release valve. It just keeps tightening.
The Oil Shock Accelerant
WTI crude has gone from $78 in December 2025 to $99 by the end of February — a 27% move in ten weeks. The Strait of Hormuz handles roughly 20% of global oil supply. With US-Iran hostilities and Dubai airspace shut down, the supply shock is structural, not speculative.8 If oil sustains above $100:
- Gasoline at the pump spikes → consumer discretionary spending drops → subprime auto stress accelerates
- Energy input costs rise → corporate margins compress → earnings downgrades across software/SaaS
- CPI re-accelerates → the Fed stays frozen → no rate cuts through 2026
- BDC borrowers — many of them asset-light software companies — face higher operating costs with no rate relief
Every link in this chain is already in motion. We are not predicting. We are describing what is happening.
VII. THE CONTAGION MAP
The private credit stress does not exist in isolation. It is one node in a cascading system. The full transmission map:
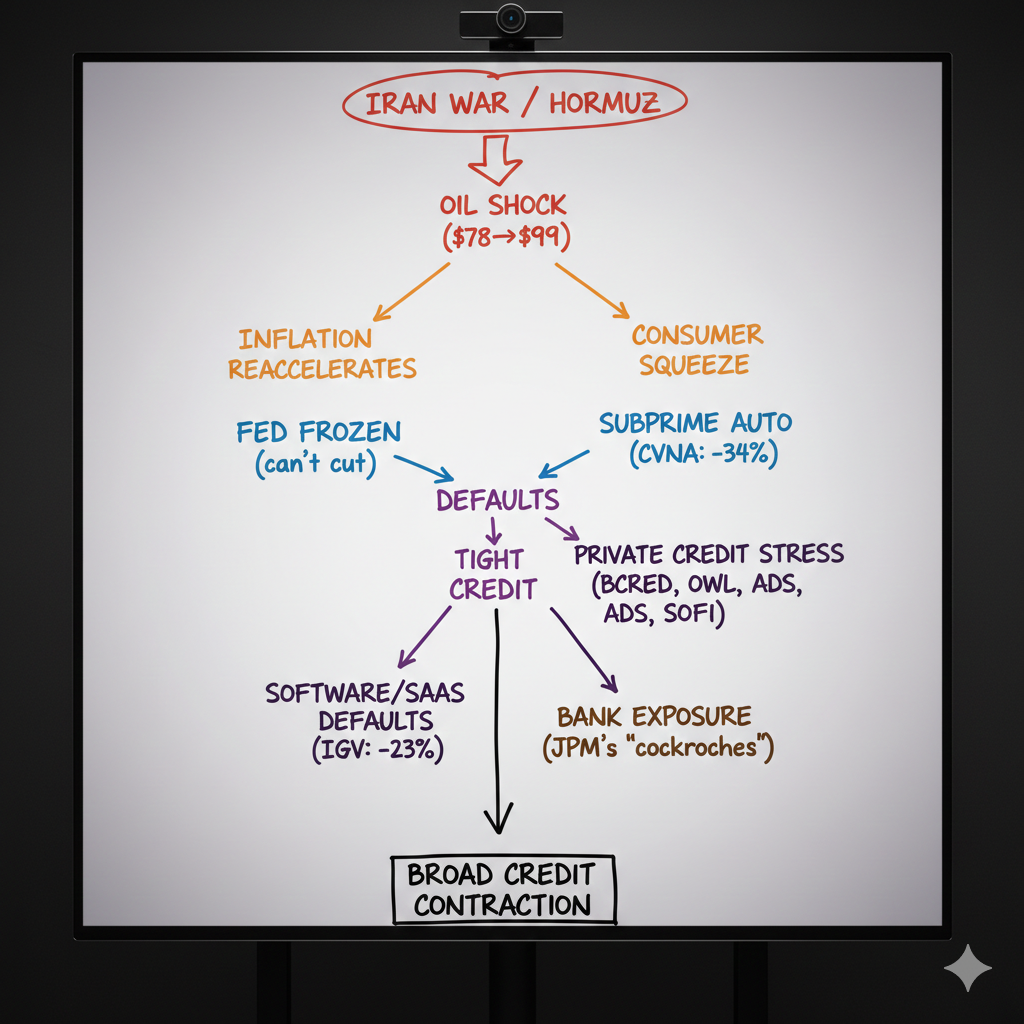
The full transmission map. Two parallel channels — inflation and consumer stress — converge on private credit, then cascade through software defaults into bank exposure and broad credit contraction.
Layer 1: Private Credit (Direct)
Non-traded BDC redemptions → forced sales → NAV declines → fee income loss at asset managers. This is what we have been tracking. BCRED is at 7% outflows. Blue Owl has gated. OWL is down -60% from its all-time high.
Layer 2: Software/SaaS Borrowers
The collateral problem we identified — mid-market software under pressure from AI disruption and a -23% public selloff — does not stay contained. As BDC loan books weaken, the sponsors tighten credit lines to their PE-backed borrowers. Tighter credit → leveraged startups cannot refinance → layoffs → more defaults → more BDC losses. The stress feeds back on itself.
Layer 3: Subprime Consumer Credit
Oil shock → higher gas prices → consumer disposable income squeezed → subprime borrowers miss payments.
CVNA ($485 peak → $319, -34%): Three officers filed Form 4s on the same day — CFO Jenkins sold 12,750 shares, COO Huston sold 10,000 shares, VP Palmer sold 1,000 shares.9 When the CFO and COO are both selling on the same day their stock is down 34% from the high, they see something the market has not fully priced.
We have been tracking Carvana Auto Receivables Trust loan tapes since our short thesis was published on February 4.10 Sub-550 FICO cohort, ~33% underwater rate, extension patterns near triggers. The 2026-P1 filing expected in March or April will show whether the oil shock is accelerating delinquencies. This is the consumer credit leg of the crisis.
Layer 4: Consumer Fintech
SOFI ($29 peak → $18.61, -36%): Revenue is still growing — $734M → $1.03B over four quarters, beating every estimate. CEO Noto bought 56,000 shares on March 2.11 The bank charter gives them deposits and diversified revenue. SOFI’s borrower base is higher-FICO, higher-income — less subprime-exposed than CVNA.
But in a broad credit crisis with unemployment at 4.3% and climbing, even prime borrowers default. If SOFI’s credit metrics deteriorate, the crisis has jumped from subprime to prime. That is 2008 territory.
Watch: SOFI earnings (May 5) — net charge-off rate and delinquency trends on their personal loan book.
Layer 5: Bank Exposure to Shadow Banking
The big banks — JPM, GS, MS — are lenders TO these non-traded vehicles. Jamie Dimon’s “cockroaches” warning was not idle speculation — he can see the credit lines his bank extended.12
If private credit vehicles cannot meet redemptions → they draw on bank credit lines → banks see increased utilization → banks tighten terms or pull lines → the liquidity crisis escalates → forced selling at worse prices → more redemption pressure. This is the feedback loop that turns a contained private credit problem into a systemic banking concern. It has not happened yet. But the channel is open.
Layer 6: The Broad Market
SPY sits at $680, only -3.5% from its January high. The equity market has not fully woken up. But the credit markets are screaming: BIZD -14%, IGV -23%, CVNA -34%, SOFI -36%, OWL -60%. If the credit contraction spreads from shadow banking to traditional banking, or if oil pushes past $110, the equity market will catch down to what the credit markets are already telling us.
VIII. THE CRITICAL DISTINCTION — LIQUIDITY VS. CREDIT
Everything in this thesis turns on one question: does the private credit stress remain a liquidity crisis, or does it become a credit crisis?
| Factor | Liquidity Crisis (Current) | Credit Crisis (Escalation) |
|---|---|---|
| Loan prices | 99.7% face (Blue Owl sale data) | 80-90% face |
| Default rate | Isolated (First Brands, Tricolor) | Systemic software/SaaS defaults |
| Who wins | ARCC, MAIN, BXSL (buy cheap assets) | Nobody — but MAIN least damaged |
| Who loses | OWL, OTF (fee income, brand) | All BDCs; OWL potentially terminal |
| Recovery time | 2-3 quarters | Multi-year |
| Fed response | None needed | Potential shadow bank intervention |
Right now, the data says liquidity crisis. Blue Owl sold loans at 99.7 cents — the loans themselves are performing. But the software sector deterioration is the channel through which liquidity stress could morph into credit stress. The VanEck BDC Income ETF (BIZD) is down -15.2% trailing twelve months despite double-digit yields — the market is pricing in credit losses that have not fully materialized yet.
The bull case is straightforward: floating-rate loans generate more income when rates stay high. Yields are at record levels. Distributions are covered. But higher yield is irrelevant if principal is impaired — a 12% coupon means nothing at 70 cents on the dollar. The question is not what the portfolio earns, but whether the borrowers can keep paying. With software valuations compressing, oil squeezing margins, and the first defaults already surfacing, the credit risk is overtaking the interest rate benefit.
The Software/SaaS Nexus
The collateral problem we identified — mid-market software under structural pressure from AI disruption and a -23% public selloff — is the channel through which liquidity stress becomes credit stress. The deterioration creates a two-way feedback loop:
- Public SaaS multiples compress → private software valuations fall → BDC loan coverage ratios deteriorate → credit quality weakens
- BDC forced selling at distressed prices → secondary market signals weakness → more public market selling
The feedback is already running. The question is whether it runs fast enough to turn performing loans into non-performing ones before the macro environment eases. With the Fed frozen and oil above $95, we believe the answer is yes.
What Happens When the 5% Cap Binds
The cap is already binding at multiple funds. When it does, boards face three options — none of them benign:
- Upsize — OTIC did
15.4%, BCRED did7%, OCIC exceeded5%. Drains fund liquidity. May require selling best-quality loans first, leaving the portfolio with worse average credit quality. - Gate — Blue Owl halted redemptions at one fund. Rejects excess tenders, creating queued demand that amplifies next quarter’s pressure.
- Promissory notes — pay with IOUs instead of cash. Signals illiquidity. Raises legal risk.
Upsizing depletes the fund. Gating triggers the first-mover panic we described — the rational stampede toward narrow exits. Notes signal distress. All four sponsors are confronting these choices simultaneously, and the macro environment that would ease the pressure is moving in the wrong direction.
IX. WINNERS AND LOSERS
If the stress continues — liquidity crisis deepening, credit crisis threatening — not every name in private credit gets hurt the same way. The 8 public stocks in the private credit orbit fall into three distinct exposure categories:
Type 1: Asset Managers — Revenue equals management and incentive fees on AUM. If non-traded AUM shrinks, fees shrink. OWL, CG.
Type 1b: Advisory/Analytics — Revenue equals fixed annual fees from institutional clients for allocation advice, manager selection, and portfolio analytics. Not tied to AUM marks. HLNE.
Type 2: Publicly Traded BDCs — Own loans directly. Exchange-traded, no redemption gates, no forced selling. Value equals portfolio credit quality. ARCC, MAIN, BXSL.
Type 3: Hybrid — Publicly traded BDCs managed by sponsors whose non-traded vehicles are stressed. Portfolio overlap plus parent distraction. OTF (Blue Owl), MFIC (Apollo).
LOSERS
OWL (Blue Owl Capital) — $10.27 | Asset Manager
OWL is ground zero. It is not a BDC — it is the asset manager that runs OCIC, OTIC, and OBDC2. Every dollar redeemed reduces OWL’s ~1.25% annual management fee base.
The evidence of distress is comprehensive: halted redemptions at a private retail debt fund, $1.4B in asset sales, OTIC upsized to 15.4% of outstanding, Barclays downgraded to Equal-Weight with a target cut from $15 to $11, stock down -60% from ATH, founders who took personal loans against their shares.13
The doom loop is structural. Redemption stress → headlines → more redemption requests → forced sales → brand damage → new capital raises freeze → AUM declines → fee income permanently impaired. Nobody inside OWL is buying their own stock at -60%. The silence is deafening.
OTF (Blue Owl Technology Finance) — $11.81 | BDC
Double exposure: a tech-focused BDC in the SaaS-pocalypse, with a parent company in crisis. 49.6% of OTF’s portfolio sits in software and technology — the sector where IGV is down -23% YTD.14 Blue Owl is trying to rotate out of the concentration, but cannot move fast enough.
MFIC (MidCap Financial — Apollo) — $10.44 | BDC
Apollo’s non-traded ADS fund is at 97% fill rate — one quarter from the cap binding. If Apollo upsizes ADS redemptions or sells assets, portfolio overlap with MFIC is likely. Smaller, less liquid, less diversified than sector leaders.
CG (Carlyle Group) — $51.66 | Asset Manager
Diversified alternatives manager with private credit as one vertical. Less directly exposed than OWL, but subject to narrative contagion. When the headlines read “private credit stress,” Carlyle is on the list regardless of its actual exposure.
WINNERS
ARCC (Ares Capital) — $18.95 | BDC | Buyer of Last Resort
The structural winner if Scenario 2 plays out.
ARCC cannot be redeemed — it is exchange-traded with no gates and no forced selling. It is the largest publicly traded BDC at ~$25B+ in assets, with massive credit facilities for deployment. When forced sellers dump performing loans at 97-99 cents, ARCC has the capital to buy. Every discounted loan purchase is instantly accretive to NAV.15
The opportunity math: $2B in performing first-lien loans purchased at 97 cents = $60M immediate NAV accretion, roughly 3% at current prices. Wider spreads on new originations in a stressed market boost yield further. COO bought 15,000 shares on February 10 during the sector panic. Currently yielding ~10%.
Risk: Ares also runs APMF and ASIF, both showing stress. Brand contagion is possible. And if this becomes a true credit crisis, ARCC’s existing book marks down like everyone else.
MAIN (Main Street Capital) — $57.20 | BDC | Flight to Quality
The most structurally insulated name in private credit. Internally managed — no external manager fees, no parent company risk, no conflict between public and non-traded vehicles. Lower middle market — borrowers too small for mega-cap private credit, zero portfolio overlap with BCRED, OCIC, or ADS forced sales. Best-in-class credit quality across multiple cycles. Trades at a premium to NAV that tends to expand in crises as capital flees to quality within the sector.
BXSL (Blackstone Secured Lending) — $24.33 | BDC | Mixed
The most nuanced setup. Solid Q4 results (Net Investment Income $0.80/share), authorized $250M buyback, mostly first-lien senior secured at 88.1% floating rate. RBC and KBW maintaining Outperform.16
The BCRED overlap cuts both ways. Negative: if BCRED dumps $3.7B+ in assets, overlapping BXSL positions could mark down. Positive: Blue Owl’s loan sales at 99.7% validate the marks on public BDCs. If BCRED sells at similar levels, it proves BXSL’s NAV is real. Blackstone likely prioritizes BXSL stability over BCRED — BXSL is the public flagship.
X. THE CORE PAIR — LONG HLNE / SHORT OWL
This is the cleanest expression of the private credit stress thesis. Both stocks are classified as “private credit” by the market, but they are fundamentally different businesses with opposite exposure to the same catalyst.
HLNE (Hamilton Lane) — $107.37 | Advisory
HLNE is not a fund manager. It is a private markets advisory and analytics firm — structurally different from OWL and CG, and arguably a beneficiary of private credit stress.
From the 10-K (FY ending March 31, 2025): total Assets Under Advisement (AUA) + AUM of $958 billion, of which $819B (86%) is non-discretionary advisory AUA — HLNE does not hold or manage this money.17 It advises institutions on how to allocate it. Fee-earning AUM of $72B generates fees based mostly on commitments or net invested capital, which — per the filing — “are not affected by market appreciation or depreciation.” Revenue is fixed annual advisory fees, not basis-point AUM fees. Client base: 47% public pension funds, 30% sovereign wealth funds — the stickiest, least likely-to-redeem institutional capital on Earth.
Why HLNE wins when private credit breaks:
When OWL’s clients panic, they call to say “I want my money back” → OWL loses AUM → OWL loses fees. When HLNE’s clients panic, they call to say “Help us navigate this crisis” → HLNE gets paid the same fixed fee, or more, because the complexity increases. Advisory demand spikes in stress — portfolio restructuring, secondary market analysis, rebalancing, manager review. All billable. The Cobalt LP analytics platform becomes more valuable when everyone needs better data on their exposures. And HLNE’s secondary investment platform helps pension and sovereign wealth clients buy distressed LP interests at discounts — they are the matchmaker.
Revenue is growing through the crisis:
| Quarter | Revenue | Net Income |
|---|---|---|
| Q2 2025 | $176M | $54M |
| Q3 2025 | $191M | $71M |
| Q4 2025 | $199M | $58M |
The Insider Divergence
The insider activity across the three asset managers reveals a stark, unambiguous signal:
OWL ($10.27, -60% from ATH): Zero open-market purchases. Co-CEOs received 878K share awards each (compensation, not conviction). Officers sold for tax withholding. Nobody is buying their own stock at the lowest price in three years.
CG ($51.66): Zero open-market purchases. CEO Schwartz sold $7.3M at $54.49 (tax withholding on vesting). No conviction signal in either direction.
HLNE ($107.37): Five insiders buying $4.2M with their own money in February 2026:18
| Insider | Shares | Price | Total |
|---|---|---|---|
| Co-CEO Hirsch | 9,225 | $107.13 | $988K |
| Co-CEO Delgado-Moreira | 9,225 | $107.00 | $989K |
| Co-Chairman Giannini | 9,225 | $107.32 | $990K |
| COO Kramer | 2,325 | $107.53 | $250K |
| Director Berkman | 10,000 | $101.00 | $1.01M |
Coordinated open-market buying by the entire C-suite. They know their business is not impaired.
Why the Pair Works
The market is treating HLNE and OWL as the same trade — “private credit names.” HLNE is down -46% from its peak, dragged by the same headlines hitting OWL at -60%. But the businesses are moving in opposite directions:
OWL ($10.27) | HLNE ($107.37) | |
|---|---|---|
| Revenue driver | ~1.25% of non-traded AUM | Fixed annual advisory fees |
| When clients panic | Redeem → AUM shrinks → fees shrink | Call for help → same or more fees |
| Revenue trend | Fee base declining with AUM outflows | Growing: $176M → $191M → $199M |
| Insider signal | Zero open-market buys at -60% | $4.2M C-suite buying at $107 |
| 3-year return | Flat. $10 → $27 → $10. Entire boom erased. | Up ~55% from 2023 despite the selloff |
| Business risk | Existential — AUM can structurally decline | Cyclical at worst — advisory contracts renew |
The round-trip is the tell. OWL’s 2023-2025 rally was built entirely on the private credit AUM boom — more non-traded vehicles, more retail capital, more management fees. That boom is now unwinding. The stock is back to pre-boom levels, but the fundamental picture is worse than 2023: gated funds, halted redemptions, brand damage, $1.7B net outflows at BCRED, Barclays downgrade. There is no obvious floor until the market can answer the question: what is OWL’s stable-state AUM after the redemption cycle ends?
HLNE’s selloff is guilt by association. The market is throwing it out with the private credit bathwater because the narrative is “private credit = broken.” But the data says HLNE’s business is accelerating into the crisis — fixed-fee revenue growing, C-suite buying millions in stock, and the fundamental demand driver (institutions needing help navigating private credit stress) is intensifying, not weakening. When the house is on fire, you do not short the fire department.
Scenario analysis for the pair:
| Scenario | OWL | HLNE | Pair Outcome |
|---|---|---|---|
| Scenario 2 accelerates (credit crisis) | Further decline — fee income permanently impaired | Holds or rises — advisory demand spikes | Big win |
| Scenario 2 continues (liquidity crisis persists) | Stays depressed — redemptions continue, no catalyst for re-rate | Stabilizes — revenue flat, market re-rates away from “private credit” basket | Moderate win |
| Scenario 1 (everything resolves) | Bounces — but to where? $15? The boom is over either way | Also bounces — from a higher fundamental base | Small loss to flat |
The pair has positive expected value in two of three scenarios and limited downside in the third.
XI. THE ASYMMETRY
The strongest trades are not the ones with the highest expected return. They are the ones where you need multiple miracles to be wrong, and just inertia to be right.
For this thesis to fail, ALL of the following must happen — simultaneously and quickly:
| Condition | Current Trajectory | Historical Precedent for Reversal |
|---|---|---|
| Iran-US war resolves, Hormuz reopens | Escalating — airspace closed, oil at $99 | No modern conflict resolved in <6 months |
Unemployment reverses from 4.3% back toward 3.7% | Rising steadily for 12 months | Unemployment trends take 12-24 months to reverse once established |
| Inflation cools enough for the Fed to cut | Core PCE 3.2%, PPI services +0.8% MoM, oil shock not yet in data | Oil shocks typically take 6-9 months to flow through CPI |
| Private credit redemptions reverse | 9/9 confirmed stress signals, BCRED at first-ever net outflows | No historical precedent for redemption panics self-correcting without intervention |
| Software sector stabilizes | IGV -23%, SaaS multiples compressing, defaults beginning | Sector corrections typically run 12-18 months |
| Yield curve normalizes (risk appetite returns) | Steepening as flight-to-safety drives long end down | Yield curve normalization has never reversed mid-cycle without a policy catalyst |
That is six independent conditions, each moving in the wrong direction, each lacking historical precedent for rapid reversal. The probability of all six flipping simultaneously is vanishingly small.
For this thesis to work, the trends just need to continue. Not accelerate. Not get worse. Just not reverse. Oil stays elevated. Unemployment keeps drifting. The Fed stays frozen. Redemptions keep coming. Software keeps struggling. These are not predictions — they are descriptions of what is already happening.
The asymmetry is structural:
- Bear case probability: High. Current trends continue. No miracles required.
- Bull case probability: Low. Requires coordinated reversal of six independent macro and credit variables with no historical template.
- Bear case payoff: OWL to
$8(-22%), HLNE/OWL pair widens, put spreads pay2-3x. - Bull case cost: OWL bounces to
$12-$13(+17-27%), pair compresses modestly, put spread premium lost.
The risk/reward is asymmetric because the thesis is built on continuation of observable trends, not on predicting anything new. Every incremental data point — the next CPI print, the next Federal Open Market Committee (FOMC) hold, the next SC TO-I filing, the next software default — either confirms the thesis or is neutral. The only thing that kills it is a synchronized, historically unprecedented macro reversal.
XII. WHAT COULD PROVE US WRONG
We hold this thesis with high conviction, but conviction without falsifiability is religion, not analysis. Here is what would break it.
The redemption cycle reverses. If Q2'26 BCRED fill rates fall back below 50%, and ADS retreats from 97%, and Blue Owl lifts its gate — the panic was genuinely temporary and we misjudged the systemic signal. This is the single most important data point to watch: the May 2026 SC TO-I/A filings.
The Fed finds a way to cut. If oil collapses (ceasefire, demand destruction, strategic reserve release), inflation cools, and the Fed delivers a surprise cut — the entire macro trap unwinds. Rate-sensitive sectors rally. Credit conditions ease. Non-traded vehicles stabilize. This is low probability given the Iran conflict trajectory, but it is the most direct falsifier.
Software credit quality holds. If public BDC earnings in April and May show flat non-accrual rates — no new defaults, no deterioration beyond First Brands and Tricolor — the liquidity crisis stays contained and does not cross into credit. The OWL short still works on fee income alone, but the broader contagion thesis weakens.
The “99.7 cents” holds across forced sales. Blue Owl sold $1.4B at 99.7 cents. If subsequent forced sales at BCRED and OCIC also clear at 98-100 cents, the loans are genuinely performing and the crisis is purely a vehicle-level liquidity mismatch, not a credit problem. This validates public BDC NAVs and limits downside for ARCC, MAIN, and BXSL.
HLNE’s advisory model proves less differentiated than we think. If HLNE’s next earnings show revenue declining — advisory mandates cancelled, fixed fees renegotiated — the “fire department” thesis is wrong. The $4.2M in insider buying would be a false signal. We consider this the lowest-probability falsifier on the list, given the 10-K disclosure on fee structure, but we are watching for it.
We do not know how this ends. We know what the filings say today, and we know the direction every variable is moving. The reader should hold us accountable to these falsifiers.
XIII. MONITORING FRAMEWORK
Confirmed Signals — 9 of 9 Triggered
| # | Signal | Status | Date |
|---|---|---|---|
| 1 | BCRED fill rate breaches 5% cap | Confirmed — upsized to 7% | Mar 3, 2026 |
| 2 | BCRED net outflows (first ever) | Confirmed — $1.7B net out | Mar 3, 2026 |
| 3 | Blue Owl halts redemptions at a fund | Confirmed — gate + $1.4B asset sale | Feb 2026 |
| 4 | Oil above $90 / Hormuz disrupted | Confirmed — $99.14 weekly close | Feb 27, 2026 |
| 5 | PPI services hot (>0.5% MoM) | Confirmed — +0.8% MoM | Feb 27, 2026 |
| 6 | Software ETF (IGV) down >20% | Confirmed — -23% from Dec peak | Mar 3, 2026 |
| 7 | BDC ETF (BIZD) hits new lows | Confirmed — $12.40 intraday | Mar 3, 2026 |
| 8 | BX stock down >40% from ATH | Confirmed — -50% | Mar 3, 2026 |
| 9 | Subprime insider selling (CVNA CFO + COO) | Confirmed — 3 officers filing same day | Mar 3, 2026 |
Pending Signals — 7 to Watch
| # | Signal | Expected Timing | What It Would Mean |
|---|---|---|---|
| 10 | February CPI prints >3% headline | Mid-March BLS release | Oil shock in the data, Fed stays frozen |
| 11 | Fed holds rates at March FOMC | Mid-March | Confirms the put is off |
| 12 | Public BDC non-accrual rates rise | April-May earnings | Credit crisis confirmed, not just liquidity |
| 13 | ADS fill rate breaches 100% | May 2026 (Q1 filing) | Second-largest fund cap binding |
| 14 | 3+ new SaaS/software defaults | Ongoing | Sectoral credit crisis |
| 15 | Bank credit lines to shadow banks tighten | Q2 2026 | Systemic banking contagion |
| 16 | CVNA Asset-Backed Securities (ABS) delinquency rates spike | March-April (2026-P1) | Consumer credit leg confirmed |
Key Dates
| Date | Event | What to Watch |
|---|---|---|
| Mid-March 2026 | February CPI release | Oil shock impact on headline and core |
| Mid-March 2026 | FOMC meeting | Rate decision + dot plot — any signal of cuts? |
| March-April 2026 | CVNA 2026-P1 ABS filing | Consumer credit canary — delinquency rates |
| April-May 2026 | Q1 earnings: ARCC, MAIN, BXSL, OTF, MFIC | Non-accrual rates — liquidity or credit? |
| May 5, 2026 | SOFI earnings | Personal loan charge-off rate |
| May 2026 | BCRED/ADS Q1'26 final SC TO-I/A filings | Fill rates — are they still accelerating? |
| August 2026 | Q2'26 filings | If fill rates still >90%, this is structural |
Additional Canaries
| Ticker | Type | What It Tells Us | Current | From Peak |
|---|---|---|---|---|
| BIZD | BDC ETF | Sector-wide BDC health | $12.96 | -14% |
| IGV | Software ETF | BDC borrower base health | $84.12 | -23% |
| CVNA | Subprime auto | Consumer credit stress | $318.99 | -34% |
| SOFI | Consumer fintech | Prime/near-prime credit | $18.61 | -36% |
| CL (WTI) | Crude oil | Inflation accelerant | $95-99 | +27% |
| SPY | Broad market | Equity risk pricing | $680 | -2% (lagging) |
XIV. THE BOTTOM LINE
The 5% quarterly cap was never a guardrail. It was a fiction — a promise of liquidity backed by assets that cannot be liquidated, maintained only as long as nobody tested it.
Eight funds are testing it now. Four sponsors are scrambling to respond. Blackstone upsized beyond the cap and still recorded net outflows. Blue Owl gated investors entirely. Apollo is one quarter from binding. Ares watched redemptions go 161x in six quarters.
This is not a prediction. It is a reading of public filings that anyone can download and verify. The math is simple. The pattern is consistent. The macro environment that would need to ease for this to resolve is instead accelerating every transmission mechanism we track — oil, inflation, the Fed, software credit, consumer stress.
The run is quiet. It is happening in SC TO-I filings that most investors will never read, at funds with no ticker, no trading floor, no CNBC alert.
Runs do not stay quiet.
APPENDIX: DATA SOURCES AND METHODOLOGY
SEC EDGAR Filings
| Entity | CIK | Filing Type |
|---|---|---|
| BCRED (Blackstone) | 0001803498 | SC TO-I, SC TO-I/A |
| OCIC (Blue Owl) | 0001812554 | SC TO-I, SC TO-I/A |
| ADS (Apollo) | 0001837532 | SC TO-I, SC TO-I/A |
| OBDC2 (Blue Owl) | 0001655887 | SC TO-I, SC TO-I/A |
| OTIC (Blue Owl) | 0001869453 | SC TO-I, SC TO-I/A |
| APMF (Ares) | 0001876006 | SC TO-I, SC TO-I/A |
| ASIF (Ares) | 0001918712 | SC TO-I, SC TO-I/A |
| AS3 (Apollo) | 0001978024 | SC TO-I, SC TO-I/A |
All SC TO-I/A filings were retrieved programmatically from SEC EDGAR and parsed for final amendment results. Data normalized as described in Section III.
Macroeconomic Data
- Bureau of Labor Statistics: CPI (CUUR0000SA0), PPI Final Demand (WPUFD49116), unemployment rate (LNS14000000), gasoline prices
- Core PCE: Morgan Stanley estimate for January 2026
- Oil prices: WTI front-month futures, weekly closes
Insider Trading Data
- SEC Form 4 filings via EDGAR for CVNA, OWL, CG, HLNE, SOFI, ARCC
- Financial Modeling Prep insider trades API for aggregation and filtering
Portfolio Holdings
- OTF industry breakdown: 10-K filing, December 31, 2025 schedule of investments
- ARCC, BXSL, MAIN: 10-K/10-Q schedule of investments (1940 Act registered investment companies)
- HLNE business model: 10-K, FY ending March 31, 2025
Analyst Ratings
- Consensus data and price targets via Financial Modeling Prep
- Individual rating actions: Barclays (March 2, 2026), Deutsche Bank (February 24, 2026), Oppenheimer (February 2026)
Disclosure: The author’s primary trade expression for this thesis is a long HLNE / short OWL pair. The author also holds a short position in CVNA via options structures, as disclosed in our February 4, 2026 report. Additional monitoring positions across the BDC sector are tracked but not actively traded at time of publication. We have no position in ARCC, MAIN, BXSL, CG, OTF, MFIC, or SOFI. This is not investment advice. Private credit markets are illiquid by design; publicly traded equities in this sector can be volatile, thinly traded, and subject to rapid sentiment shifts. Do your own work.
Schedule TO (Tender Offer Statement) is filed pursuant to Rule 13e-4 under the Securities Exchange Act of 1934. Non-traded funds file the initial SC TO-I at the start of each quarterly offer and amend with SC TO-I/A filings through completion. The final amendment contains actual tender results. ↩︎
First Brands Group (branded as Trico Products) and Tricolor Holdings filed for restructuring in late 2025 and early 2026 respectively. Both were private credit borrowers in BDC portfolios. ↩︎ ↩︎
Preqin Global Private Debt Report, 2025. Private credit AUM grew from approximately $500B in 2014 to over $2 trillion by end of 2025, driven by institutional allocation shifts from public fixed income and the expansion of non-traded retail vehicles beginning in 2021. ↩︎
All 8 entity CIKs and filing histories are listed in the Appendix. The normalization methodology — fill rate = shares tendered / shares offered (where shares offered = 5% of outstanding) — is designed to strip out AUM growth effects and isolate genuine changes in investor exit demand. ↩︎
Blue Owl Credit Income Corp SC TO-I/A filing, Q4 2025. Blue Owl simultaneously disclosed $1.4B in asset sales at an average of 99.7 cents on the dollar, and halted redemptions at a separate private retail debt fund. See also Barclays downgrade note, March 2, 2026. ↩︎
iShares Expanded Tech-Software Sector ETF (IGV), price data as of March 3, 2026. December 2025 peak of ~$109; current ~$84. ↩︎
Bureau of Labor Statistics, Producer Price Index — Services (WPUFD49116), January 2026 release, February 27, 2026. PPI services feeds into the Personal Consumption Expenditures (PCE) deflator, which is the Federal Reserve’s preferred inflation gauge. ↩︎
For the geopolitical context and Hormuz transmission mechanism, see our companion report: “Paper, Silicon, and Crude: How the Iran Conflict Connects to the AI Supply Chain,” published March 1, 2026. ↩︎
SEC Form 4 filings for Carvana Co. (CVNA), filed March 3, 2026: CFO Mark Jenkins (12,750 shares), COO Benjamin Huston (10,000 shares), VP Ryan Palmer (1,000 shares). Chairman Ernest Garcia III surrendered 1,229 shares. See our Carvana short thesis (“Carvana: Subprime Auto in Prime Clothing,” February 4, 2026) for the full loan-tape analysis. ↩︎
Carvana Auto Receivables Trust 2024-P1 through 2025-P4 loan-level data, filed with the SEC. Sub-550 FICO cohort analysis, underwater rate at origination, extension pattern monitoring documented in our February 4 report. ↩︎
SEC Form 4 filing for SoFi Technologies (SOFI), March 2, 2026: CEO Anthony Noto, 56,000 shares purchased on the open market. ↩︎
Jamie Dimon, JPMorgan Chase Q4 2025 earnings call, January 2026. Dimon’s “cockroaches” comment referred to the risk that a small number of visible private credit defaults represent a larger population of unrevealed problems. Separately, Mizuho analyst Mike Ricchiuto flagged bank credit lines to non-traded vehicles as a key systemic risk channel. ↩︎
Barclays equity research, “Blue Owl Capital — Downgrade to Equal-Weight,” March 2, 2026. Target cut from $15 to $11. Deutsche Bank also cut target on February 24, 2026. ↩︎
Blue Owl Technology Finance Corp (OTF), 10-K, December 31, 2025. Schedule of Investments — industry concentration breakdown. Combined software/technology exposure at 49.6% of portfolio fair value, down from ~54% a year prior. ↩︎
Ares Capital Corporation (ARCC) COO purchased 15,000 shares on February 10, 2026, SEC Form 4. ARCC named top pick by Advisors Capital Management, RiverNorth Capital Management, and multiple sell-side analysts in February 2026 coverage. ↩︎
Blackstone Secured Lending Fund (BXSL), Q4 2025 earnings release. Net Investment Income of $0.80/share. Board authorized $250M share buyback program. RBC Capital Markets and Keefe, Bruyette & Woods maintaining Outperform ratings. ↩︎
Hamilton Lane Inc. (HLNE), 10-K, FY ending March 31, 2025. Total assets under advisement and management of $958B, of which $819B (86%) is non-discretionary advisory AUA. Revenue disclosure: “Growth in AUA does not have a material impact on revenues” as advisory fees are structured as fixed annual retainers. Client composition: 47% public pension funds, 30% sovereign wealth funds. ↩︎
SEC Form 4 filings for Hamilton Lane Inc. (HLNE), filed February 2026: Co-CEO Mario Giannini (9,225 shares at $107.32), Co-CEO Erik Hirsch (9,225 shares at $107.13), Co-CEO Juan Delgado-Moreira (9,225 shares at $107.00), COO Jeff Kramer (2,325 shares at $107.53), Director Leslie Berkman (10,000 shares at $101.00). All open-market purchases. ↩︎