Carvana: The Return of Subprime Auto in Prime Clothing
Why the 10,000% Rally from $4 to $415 is Built on Deteriorating Credit and a Fragile Securitization Model
I. EXECUTIVE SUMMARY
Carvana’s 10,000% rally from $4 to $415 is being celebrated as one of the greatest comeback stories in market history. We believe it is built on a foundation of deteriorating credit quality that the market has not yet recognized, hidden behind a “prime” ABS designation that was never an accurate description of the underlying collateral — and is becoming less so by the quarter.
We are short CVNA with a 12-18 month price target of $165-250, representing 40-60% downside. The thesis rests on SEC-filed loan-level data from every Carvana Auto Receivables Trust issued since 2021 — data that anyone can download and verify. What it shows is a company where 100% of income is stated and unverified, roughly a third of all loans are underwater at origination — two to four times the industry average — and deep subprime borrowers (FICO below 550) appear in the pools for the first time in company history, all while the average FICO score holds steady at 706. The underwater rate is not a recent deterioration. It has been this way since the very first pool. The headline number is engineered. The tails tell the truth.
Three independent data sources confirm the stress is real, not just a story in the loan tapes. Google Trends shows a statistically significant multi-year rise in “car repossessed” searches (R² = 0.73, p < 0.001), with Carvana appearing as a rising related query alongside subprime auto lenders. A sentiment analysis of 309 YouTube videos from used car dealers and industry commentators — analyzed via LLM with statistical validation in R — shows 93%+ bearish signals on inventory, demand, and repossessions (all p < 0.001), with measured and sensational creators converging on the same direction. The SEC filings, the search data, and the people actually buying and selling cars all agree: something is breaking.
Carvana’s business model depends entirely on a securitization flywheel — originate loans, package them into ABS, sell to investors, repeat. Over half of gross profit comes from this cycle. If ABS investors reprice Carvana’s debt as subprime rather than prime, the flywheel seizes. The catalyst path runs through Q4 2025 earnings (February 18), the 2026-P1 loan tape (March), and the peak loss period for the 2024-2025 vintages (Q2-Q3 2026). The company carries $5.6 billion in debt with maturities starting in 2028, restructured under terms that assumed continued access to capital markets.
This is not a prediction. It is a reading of public data that the market has chosen not to read.
II. THE NARRATIVE ARC: How We Got Here
To understand where Carvana is today, you need to understand the journey. This isn’t a story about a sudden shift in strategy or a single bad decision. It’s a slow-motion transformation that happened in plain sight, masked by headline revenue growth and a “prime” designation that was misleading from the start.
2021-2022: The Golden Age
In the beginning, Carvana’s model actually worked. Between 2021 and early 2022, the company was living in an auto lender’s paradise. Interest rates sat near zero, and the COVID supply shock had sent used car prices into the stratosphere. Carvana’s revenue exploded from $5.6 billion in 2020 to $13.6 billion in 2022, and the stock hit $370 in August 2021.
The business model was elegant: originate auto loans, pool them into Asset-Backed Securities (ABS), sell those securities to investors, and use the proceeds to fund more loans. It was a perpetual motion machine, and on the surface, credit quality was solid. The average borrower had a FICO score of 705, not a single loan went to a borrower below 550, and FICO scores strongly predicted interest rates — exactly what prime auto lending is supposed to look like. But even in this golden period, one metric hinted at the fragility underneath: roughly a third of loans were underwater at origination — borrowers who owed more than their car was worth from day one. The CFPB would later find that only 8-17% of auto loans industry-wide are originated with negative equity.1 Carvana was running at two to four times that rate from the start. Remember this. It becomes important later.
2022-2023: Near-Death Experience
Then the music stopped. The Federal Reserve raised interest rates from 0% to 5.25% in one of the fastest hiking cycles in history, and Carvana’s debt—restructured during the good times but still carrying high interest rates—became crushingly expensive to service. The stock cratered from $370 to $3.55, a 99% decline. The company laid off over 4,000 employees and closed multiple markets. In 2023, Carvana was forced to restructure $5.2 billion in debt to avoid bankruptcy. This is crucial context: the company that exists today was shaped by this near-death experience. They survived, but barely. The current rally — which has taken the stock from $4 to $415, a 10,000% gain — is being framed as one of the greatest comeback stories in market history. Management points to improving metrics and restored profitability. Wall Street has largely accepted this narrative at face value. But something changed during that dark period, something that doesn’t show up in the headline numbers and that no one seems to be looking at.
2023-2024: The High-Spread Workaround
Facing an existential threat, Carvana discovered an exploit in the system. They couldn’t charge high rates to borrowers with truly bad credit—those with FICO scores of 620 or below typically can’t get approved anywhere and know they’re high-risk. But there was a sweet spot: borrowers with high FICO scores (740+) who had low liquidity, high debt-to-income ratios, or other undisclosed risk factors that didn’t show up in their credit scores.
These borrowers looked prime on paper. They had the credit scores that justified a “prime” designation for the ABS. But Carvana could charge them rates well above market — because these borrowers couldn’t get approved elsewhere despite their good scores. At the peak, nearly one in twelve borrowers with FICO scores above 740 were paying APRs above 12% — rates they would never accept if a bank or credit union would have them. The spread between what Carvana charged and the Fed Funds Rate averaged nearly 10%, with some borrowers paying 20%+ over the risk-free rate. These are not prime spreads. But wrapped in a pool with an average FICO of 700, they looked like prime ABS. This was the mechanism that kept the lights on.
Late 2024-Early 2025: The Pivot to Volume
By late 2024, the high-rate strategy had run its course. Interest rates were stabilizing, and competition was returning to the market. Banks and credit unions were once again offering 6-8% rates to genuinely prime borrowers, and Carvana couldn’t keep charging 12%+ without losing volume.
So they had a choice: accept lower volume and miss growth targets, or loosen credit standards to maintain the appearance of momentum. They chose volume.
The evidence is in the loan tapes. Starting in late 2024, Carvana began stretching loan terms longer and, for the first time in company history, lending to borrowers with FICO scores below 550 — the traditional definition of deep subprime2, a cohort that defaults at rates exceeding 40%3.
Carvana’s pools have always had a collateral problem — roughly a third of loans underwater at origination, two to four times the industry norm, in every vintage since 2021. That was manageable when the borrower pool was stronger. It isn’t anymore. Extending loan terms slows principal paydown, keeping underwater borrowers trapped in negative equity longer. Adding a deep subprime cohort that defaults at 40%+ rates means more of those underwater loans will actually go bad. And when an underwater loan defaults, Loss Given Default jumps from the 20-30% typical of positive-equity auto loans to 60-80%. The chase for volume didn’t just add new risks — it made the existing ones far more dangerous.
2025-Present: Cracks Appear
Now the consequences are starting to show. Monthly servicer reports reveal that newer vintages are losing money faster than any prior cohort at the same point in their lifecycle. The deterioration is accelerating, not stabilizing.
Meanwhile, the real-world signals are converging. Google Trends data shows a statistically significant multi-year rise in searches for “car repossessed,” while “used car market” search interest — dormant for most of 2024 — spiked sharply in late 2025. An analysis of over 300 YouTube videos from used car dealers paints a near-unanimous picture: inventory is building, demand is weakening, and repossession activity is surging. Consumers are noticing. Dealers are noticing.
Carvana’s response has been to keep writing loans to maintain volume, regardless of quality. And when the delinquency numbers in existing pools creep toward the contractual thresholds that would trigger investor protections, a curious pattern emerges in the servicer data: loan extensions — which mechanically reset the delinquency clock — spike by an order of magnitude. We’re not alleging anything. We’re going to show you the charts and let you decide.
The structural problems are now baked in — slower amortization, underwater collateral, unverified income, and deep subprime borrowers all converging in the 2024-2025 vintages. These loans will hit their peak loss period in Q2-Q3 2026.
Everything described above — the high-spread exploit, the pivot to volume, the structurally thin collateral, the extension patterns — is based on claims. Strong claims. The kind of claims that demand evidence.
Here it is. What follows is built entirely on SEC-filed data: loan-level disclosures from every Carvana Auto Receivables Trust (2021-P1 through 2025-P4), monthly servicer reports (Form 10-D), and trust indenture documents. Every number is verifiable. Every chart can be reproduced from public filings. All of our analysis code is publicly available on GitHub.
We organize the evidence into four pillars:
- Stated Income: Every single Carvana loan —
100%, across every trust, every vintage — uses unverified borrower-reported income. The denominator of every credit ratio in the portfolio is a number someone typed into a text box. - The FICO Illusion: Carvana can’t fake credit scores, but it can engineer the mix. The average FICO holds steady at
706because Carvana is adding high-score borrowers who accept subprime spreads (because no one else will lend to them) while simultaneously introducing deep subprime borrowers for the first time in company history. - Underwater Collateral: Roughly a third of all Carvana loans are underwater at origination — two to four times the
8-17%industry average documented by the CFPB. This is not recent deterioration; it has been the case across every vintage since 2021. ABS investors buying “prime” paper are holding pools where a third of borrowers have negative equity from day one. - The Extension Pattern: Loan extensions — which mechanically reduce reported delinquency — spike by an order of magnitude precisely when delinquency approaches contractual trigger thresholds. This pattern repeats across every vintage we analyzed, including the highest-quality pools Carvana ever originated.
Each pillar stands on its own. Together, they are overwhelming.
III. THE FOUR PILLARS
Pillar 1: Stated Income = Unverified Risk
What the SEC Filing Data Shows
Every single Carvana auto loan—across every trust, every vintage, from 2021-P1 through 2025-P4—is coded as Income Verification Level Code 3 in the SEC-mandated loan-level disclosures. Not most loans. Not a majority. One hundred percent.
This field is required under Regulation AB II (17 CFR 229.1125, Schedule AL)4, which forces issuers of publicly registered auto loan ABS to disclose the extent to which each borrower’s income was verified during origination. The codes are straightforward:
- Code 1: Income verified through documentation (paystubs, W-2s, tax returns, employer confirmation)
- Code 2: Income verified through alternative means (bank statements, third-party data services)
- Code 3: Stated income — borrower-reported, not independently verified
- Code 4: No income data obtained
Carvana is Code 3 across the board. The income figure in every loan file was provided by the borrower and accepted at face value by Carvana’s underwriting system.
You can verify this yourself. Each Carvana Auto Receivables Trust files its loan-level data with the SEC as Exhibit EX-102 on Form ABS-EE. These are XML files containing dozens of fields for each individual loan—credit score, LTV, APR, loan term, vehicle information, and the income verification level code. Download any of them. Filter the income verification column. Every row says the same thing.
What the Borrower Actually Experiences
Here’s what it looks like from the other side. Go to Carvana’s financing page and apply. You’ll answer roughly ten questions in about two minutes: name, address, date of birth, employment status, how long you’ve been employed, and your income. You type a number into a box. That’s it.
Carvana runs a soft credit pull and gives you a prequalification decision almost instantly—monthly payment, minimum down payment, APR. The entire process, from opening the page to seeing your rate, takes less time than ordering lunch.
Here’s the interesting part: Carvana’s help center has pages about income verification. They list acceptable documents—paystubs, bank statements, tax returns for the self-employed, Social Security statements for fixed-income borrowers. This creates the impression of a rigorous process. But buyer experiences tell a different story. Many report being approved and completing their purchase without ever being asked to upload a single income document. A Carvana employee reportedly explained that “sometimes the system can verify employment/pay info on its own” using backend tools like Plaid, which links bank accounts to view transaction history and direct deposits.
But here’s the thing: regardless of what happens on Carvana’s end—whether they glance at a Plaid feed or ask for a paystub photo—the SEC filing tells us the result. The income verification code says 3: stated, not verified. Carvana itself is telling the SEC, in a legally binding disclosure, that income is not independently verified for any loan in any pool.
Why This Matters: The Traditional Lender Comparison
When you walk into a bank or credit union and apply for an auto loan, the process looks very different. Most traditional lenders require two to three recent paystubs. Some request W-2s or tax returns. Many use third-party verification services like The Work Number (owned by Equifax) or Truework to independently confirm income directly with employers. If you’re self-employed, expect to hand over a Schedule C from your latest tax return.
This isn’t just internal policy—it shows up in the data. When traditional auto lenders securitize their loans and file with the SEC, their income verification codes reflect the documentation they collected. A mix of Code 1 and Code 2, with some Code 3 at the margins. Not 100% Code 3 across the entire book.
The “Liar Loans” Parallel
We’ve seen this movie before. In 2006-2007, mortgage lenders offered “stated income” loans—products where borrowers could claim any income and the lender would accept it without verification. The industry nicknamed them “liar loans,” and for good reason: subsequent analysis found that 60% of stated-income loans examined had overstated income by at least 50%5. The Financial Crisis Inquiry Commission specifically identified stated-income lending as a key contributor to the 2008 crisis.6
The auto loan market is smaller than housing, and the systemic implications are narrower. But for Carvana specifically, the dynamic is identical: if you don’t verify income, you can’t measure ability to pay. And if you can’t measure ability to pay, your default models are built on fiction.
What This Does to Carvana’s Credit Metrics
Carvana’s own 10-K filings cite “lower PTI” as a key advantage—claiming that their customers’ lower payment-to-income ratios “significantly enhance the quality of the automotive finance receivables” the company generates. The loan-level ABS data bears this out on its face: the weighted average PTI across 2025 pools is roughly 7.2%, down from 8.8% in 2021. That looks like improving credit quality—borrowers spending a smaller share of income on car payments.
But the denominator of that ratio is whatever the borrower typed into a text box. A borrower earning $50,000 who claims $80,000 doesn’t look like they’re stretching—their PTI reads 7% instead of the real 11%. The metric becomes not just unreliable, but actively misleading. It creates the appearance of conservative underwriting while masking the true debt burden.
This is not an abstract concern. It means every credit model built on Carvana’s reported income data—whether by Carvana’s own risk team, by ABS investors pricing subordination levels, or by rating agencies assigning AAA ratings to senior tranches—is working with an unverifiable input. Probability of Default (PD) estimates for the entire portfolio are structurally unreliable.
Pillar 2: The FICO Illusion — High Scores, High Rates, Hidden Risk
Pillar 1 established that Carvana’s income data is entirely self-reported — every loan in every pool relies on stated income that was never independently verified. Income is the one variable Carvana controls in its underwriting disclosures. If a borrower inflates their salary, the payment-to-income ratio looks conservative, the credit model assigns lower risk, and the ABS gets marketed as prime.
But there’s one metric Carvana can’t manipulate: the FICO score. Credit scores are pulled directly from the bureaus — Equifax, Experian, TransUnion. They’re third-party, independently maintained, and reported to the SEC as-is. When an ABS investor looks at a Carvana pool and sees an average FICO of 706, that number is real in a way that stated income never is.
This makes FICO the single most important signal for evaluating whether Carvana’s “prime” label holds up. And at first glance, it does.
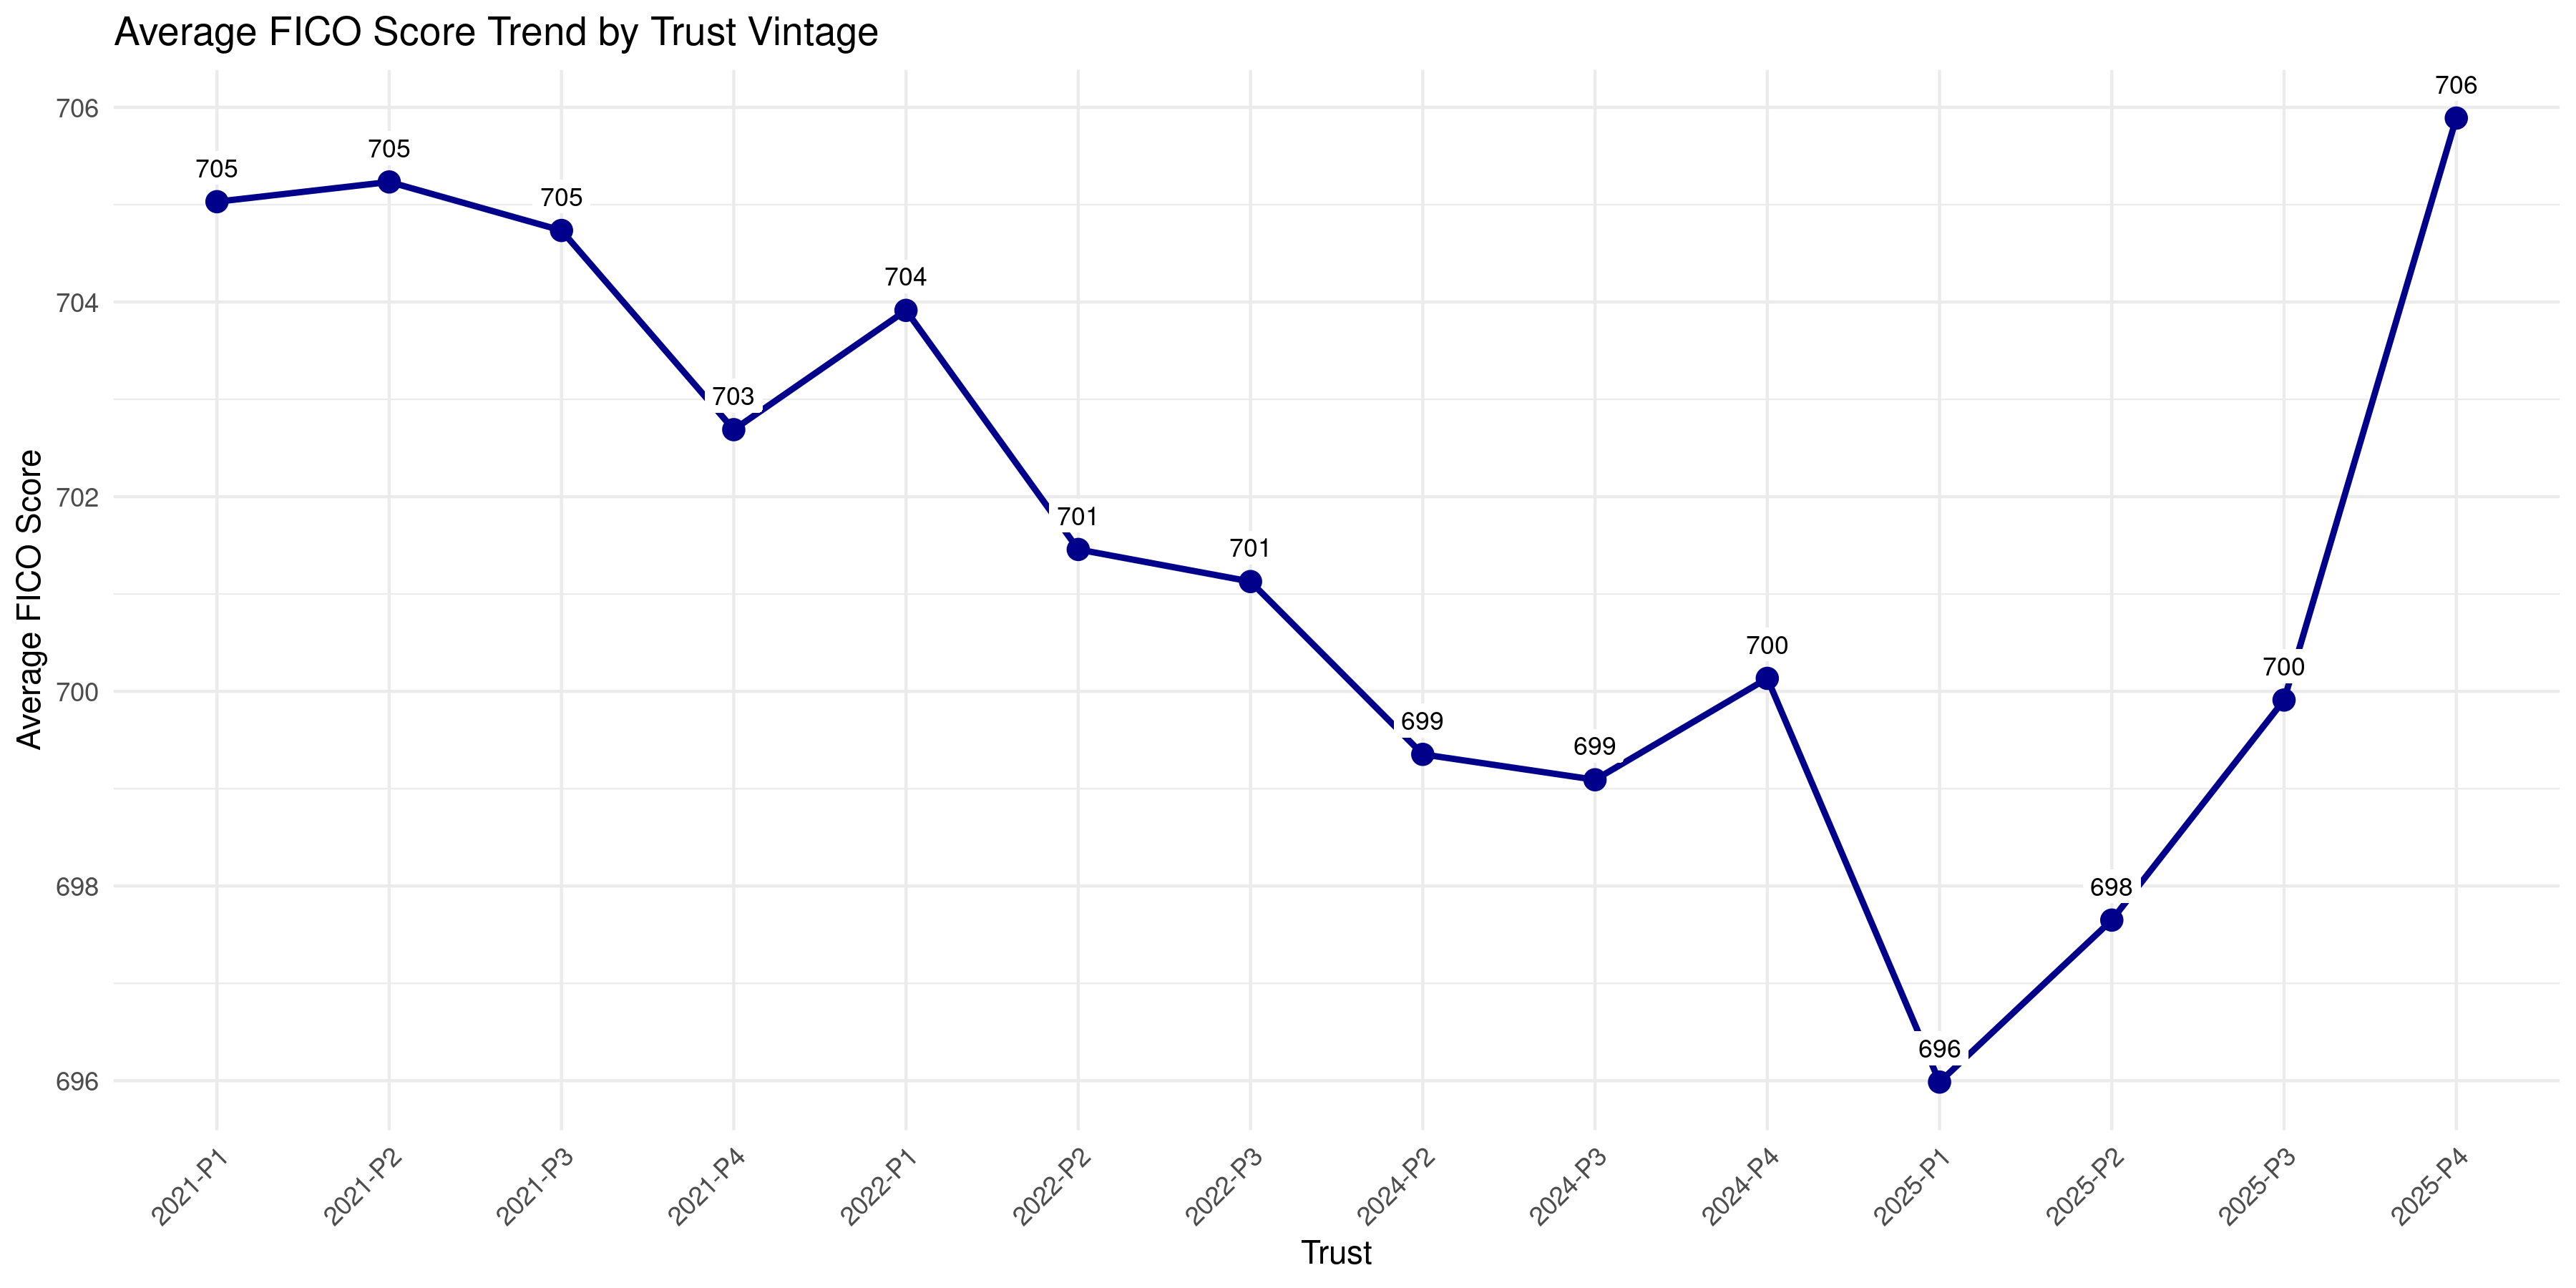
Average FICO across Carvana’s pools has barely moved. It drifted from 705 in 2021 down to 696 in 2025-P1, then recovered to 706 by 2025-P4 — essentially back to where it started. This is the number management cites. This is the number rating agencies anchor to.
If you stopped here, you’d conclude that credit quality is stable, maybe even improving. But the average is a mirage. What changed isn’t the center of the distribution — it’s the tails.
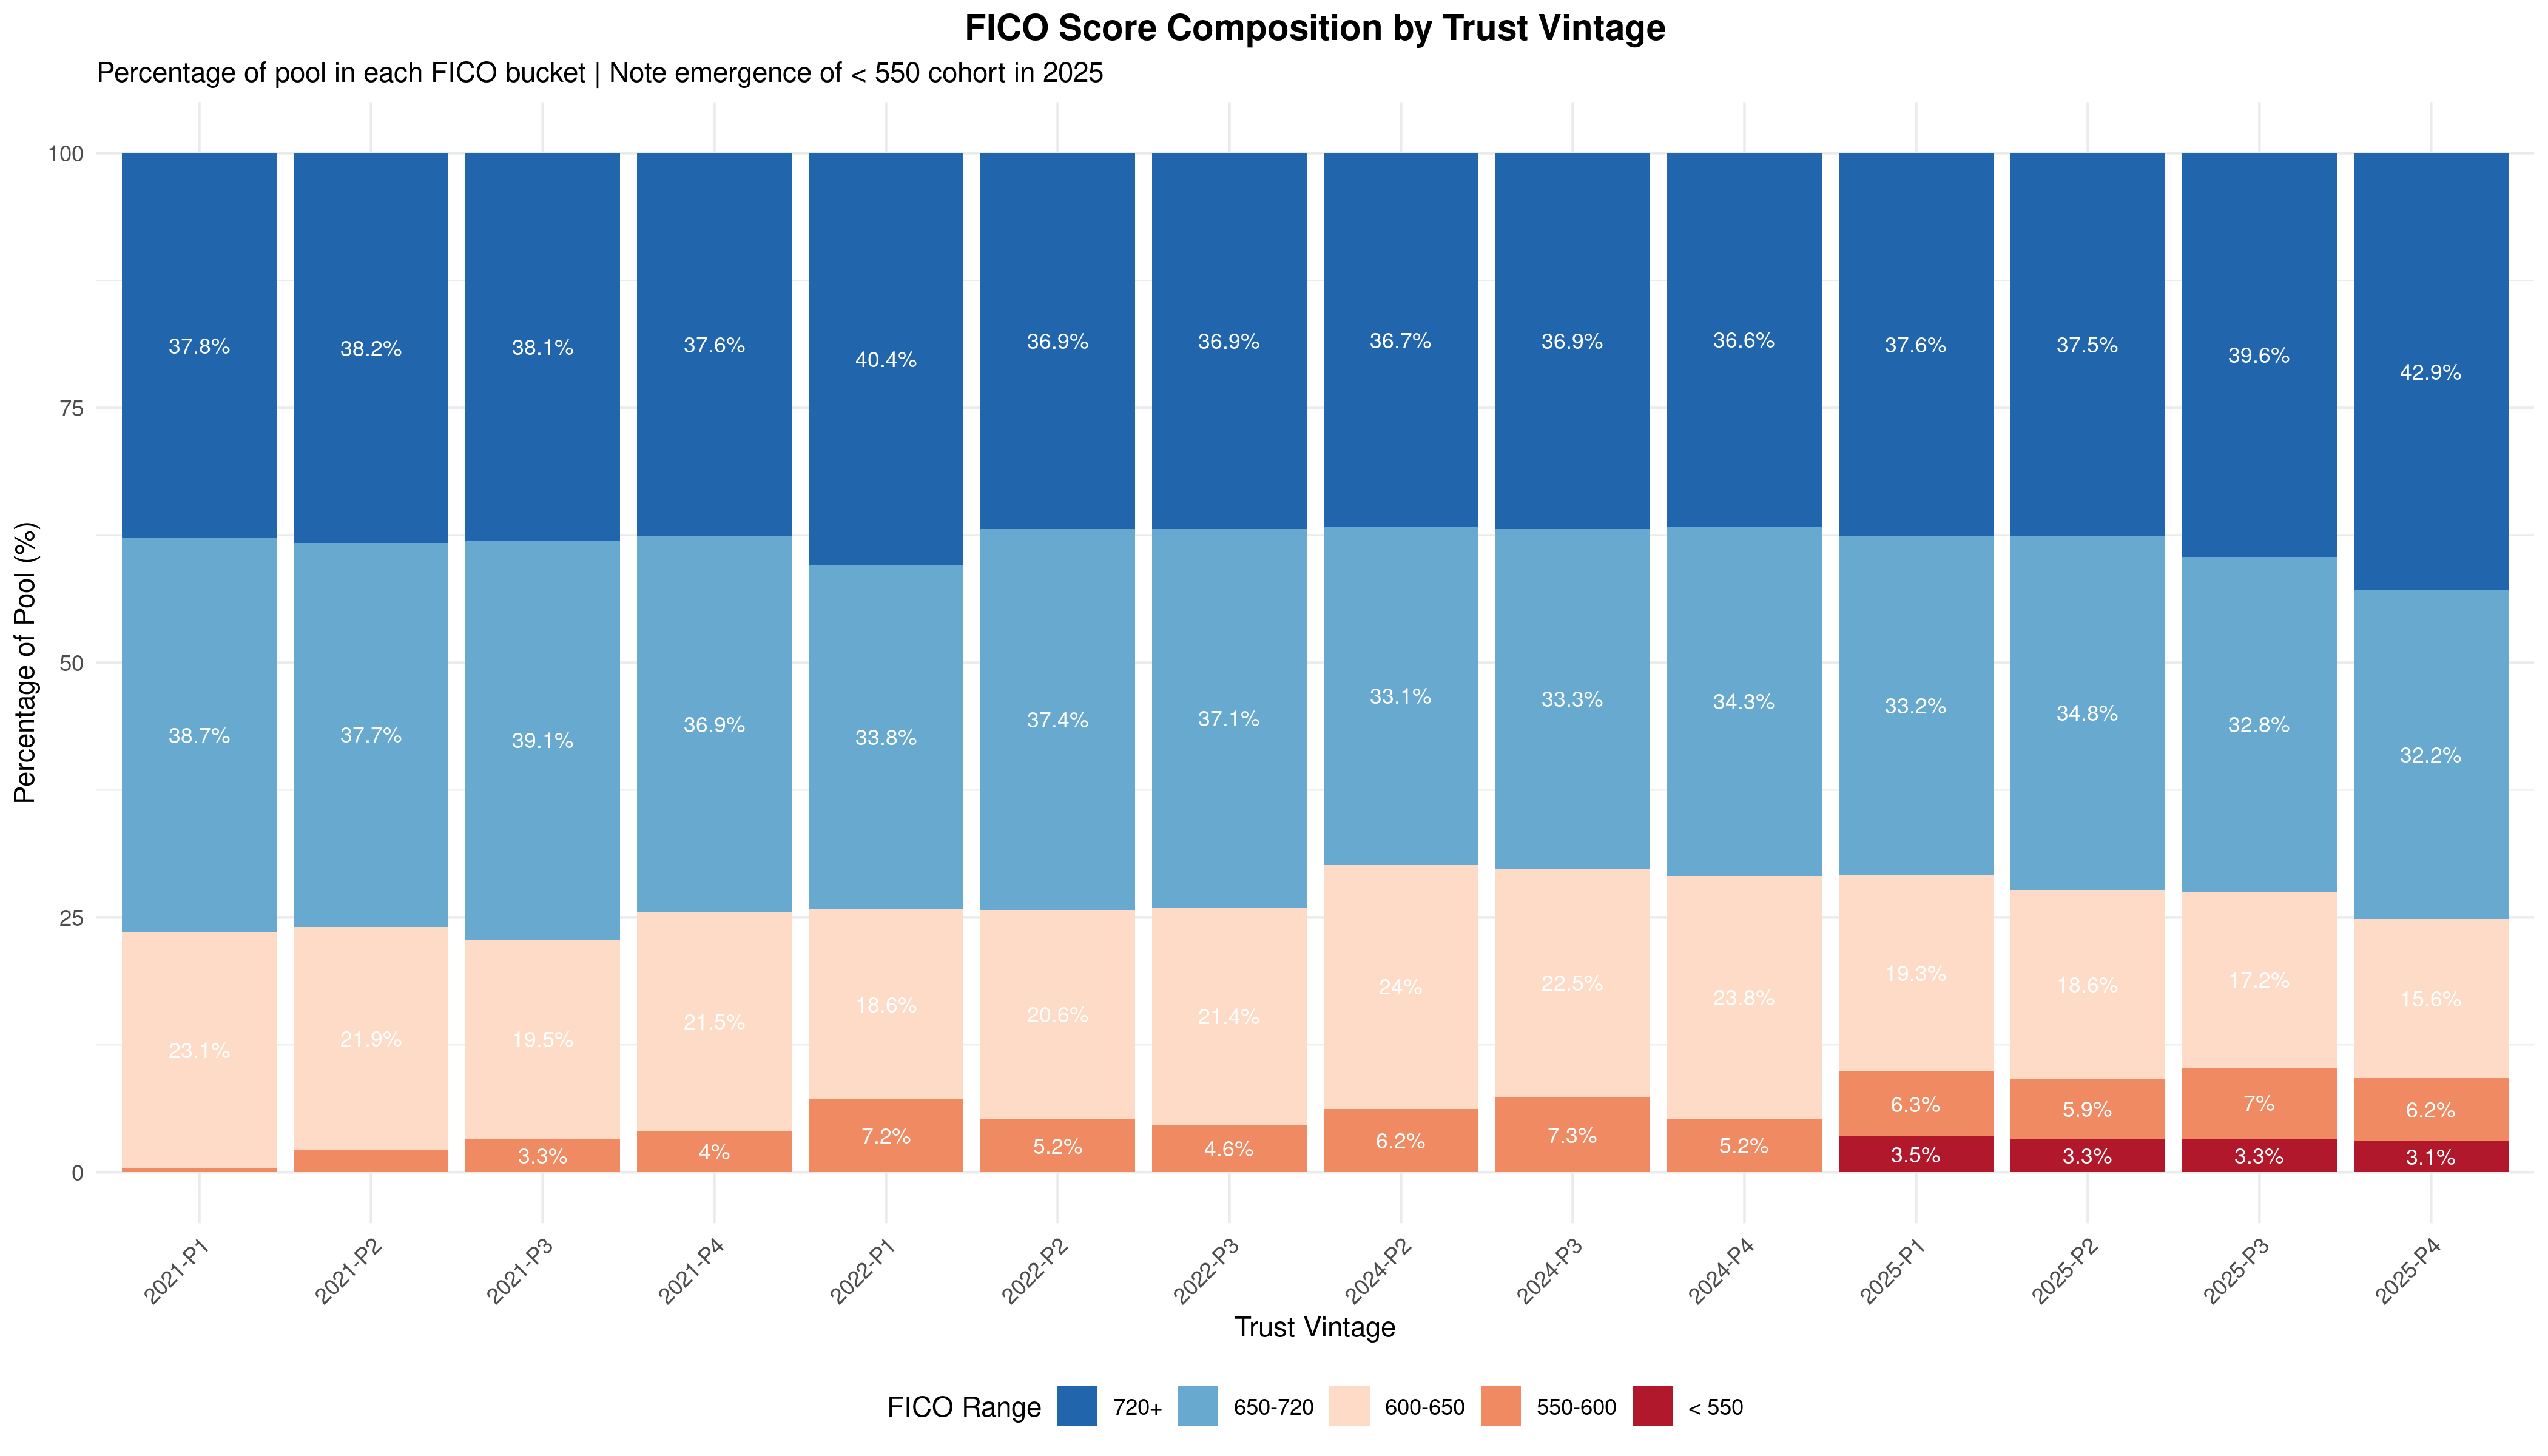
FICO score composition by trust vintage. The < 550 cohort (deep subprime, dark red) is completely absent from 2021-2024 vintages but appears at 3.1-3.5% in every 2025 pool. At the same time, the 720+ share surges to 42.9% in 2025-P4 — the highest level ever recorded. The average FICO holds steady because both tails fattened simultaneously.
Between 2021 and 2022, Carvana’s FICO composition was remarkably stable: roughly 37-40% of borrowers scored 720+, another 37-39% fell in the 650-720 range, and the remainder clustered in the 600-650 band. The sub-600 tail was minimal, and borrowers below 550 — deep subprime by any industry standard — simply didn’t exist in the pools. Zero. Across every vintage from 2021-P1 through 2024-P4, not a single pool contained a meaningful sub-550 cohort.
Then 2025 arrived, and two things happened simultaneously. At the bottom, a sub-550 cohort appeared for the first time in company history — 3.5% of 2025-P1, holding steady at 3.1-3.3% through 2025-P4. At the top, the 720+ share surged from its historical ~37% to 42.9% in 2025-P4.
This is not organic improvement in credit quality. This is portfolio construction — deliberate targeting of high-FICO borrowers to offset the deep subprime additions and keep the average stable. Carvana can’t fake the FICO scores, but they can engineer the mix.
The question is: who are these new high-FICO borrowers, and why are they financing through Carvana instead of walking into a credit union and getting a 5-7% rate?
The answer is in the spreads.
When Prime Borrowers Pay Subprime Rates
If Carvana’s 740+ FICO borrowers were genuinely low-risk prime customers, they would never accept the rates Carvana charges. A borrower with a 760 FICO can walk into any bank in America and get an auto loan at 5-7% APR. They have options. They have leverage. They do not voluntarily pay 12-15%.
Unless they can’t get approved elsewhere.
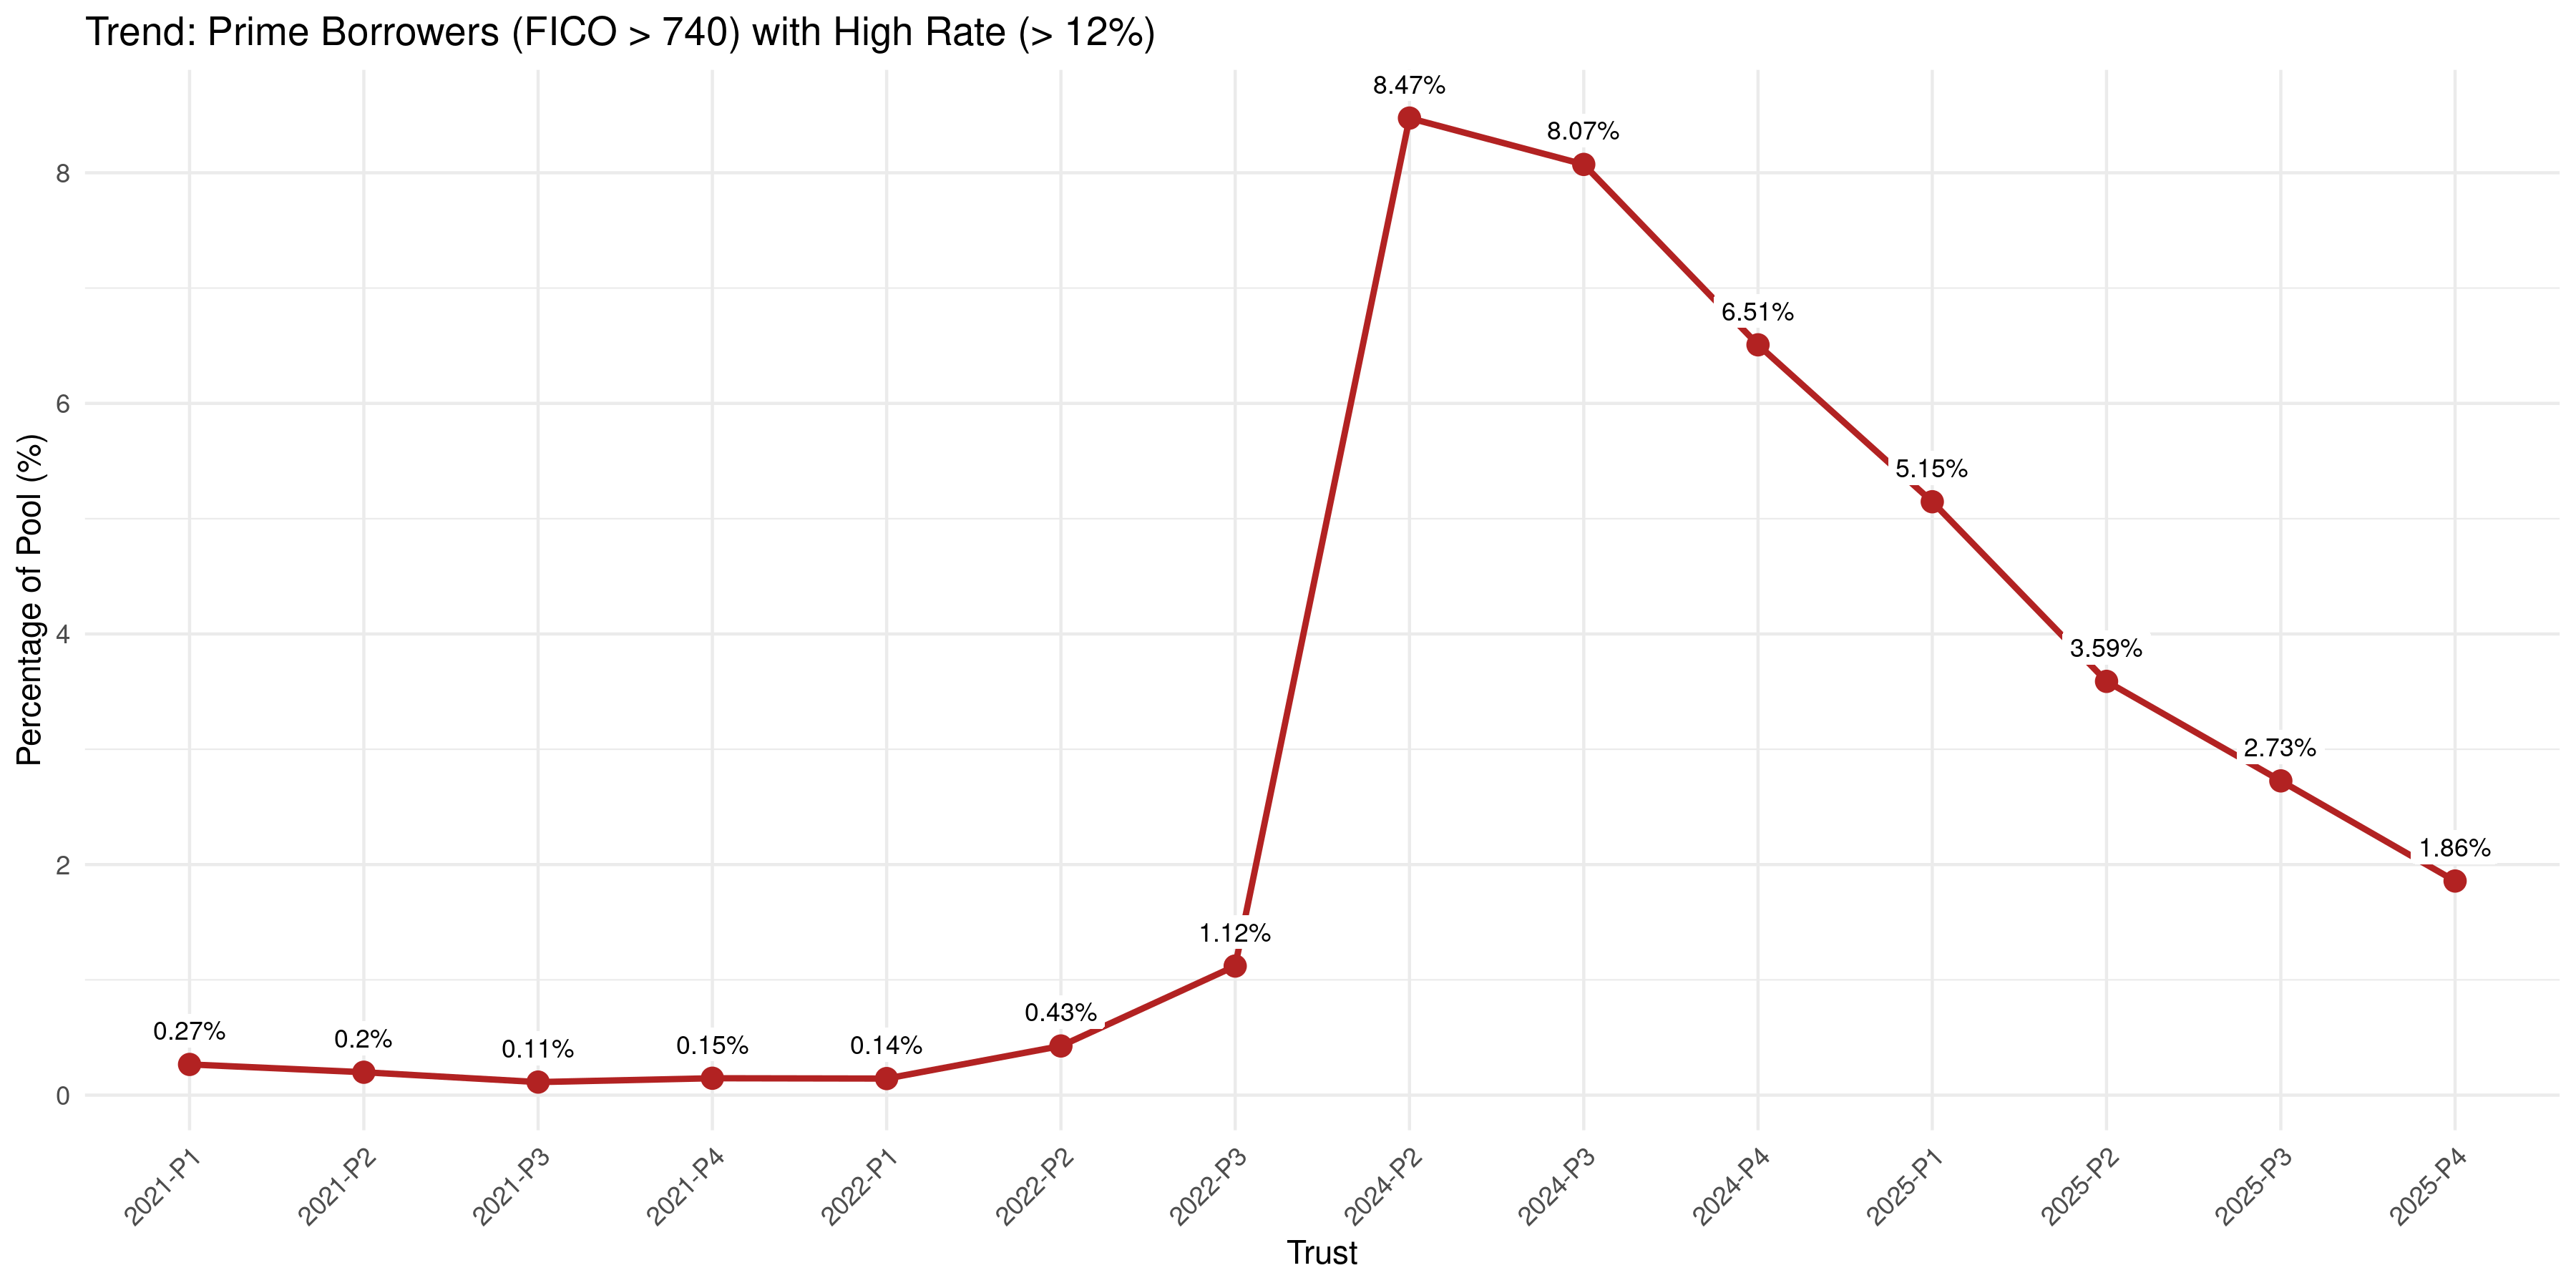
Percentage of the total pool consisting of FICO > 740 borrowers charged APRs above 12%, by trust vintage. At the peak in 2024-P2, 8.5% of the entire pool — one in twelve loans — consisted of high-credit-score borrowers paying rates that no traditional prime lender would charge. Flip the denominator and the picture is starker: 26.8% of Carvana’s 740+ FICO borrowers were paying subprime rates — more than one in four. These are likely thin-file or new-credit borrowers whose scores haven’t yet caught up with their actual risk profile. By 2025, increased competition from banks and credit unions compressed both figures, but the structural pattern remains: Carvana consistently charges rates that genuine prime borrowers would never accept unless they had no alternative.
Why would a 740+ FICO borrower have no alternative? Because FICO doesn’t capture everything. A borrower can have a high credit score and still be a poor credit risk if they carry a debt-to-income ratio above 50%, have a thin credit history with only a few months of established accounts, recently experienced a derogatory event that hasn’t yet hit their score, or simply lack the verifiable income documentation that traditional lenders require. These are the borrowers Carvana targets — high scores, hidden risk factors, and no other options.
This explains the composition shift. The surge in 720+ borrowers in 2025 isn’t Carvana attracting better customers. It’s Carvana targeting borrowers whose FICO scores mask underlying weakness — borrowers who look prime in a loan tape but who accept rates that embed significant credit risk because they can’t get approved anywhere else.
The Spread Tells the Truth
The clearest way to see this is through spread distributions — the gap between each borrower’s APR and the prevailing Fed Funds Rate. In a genuinely prime pool, spreads cluster tightly around 3-6%. Here is what Carvana’s pools actually look like.
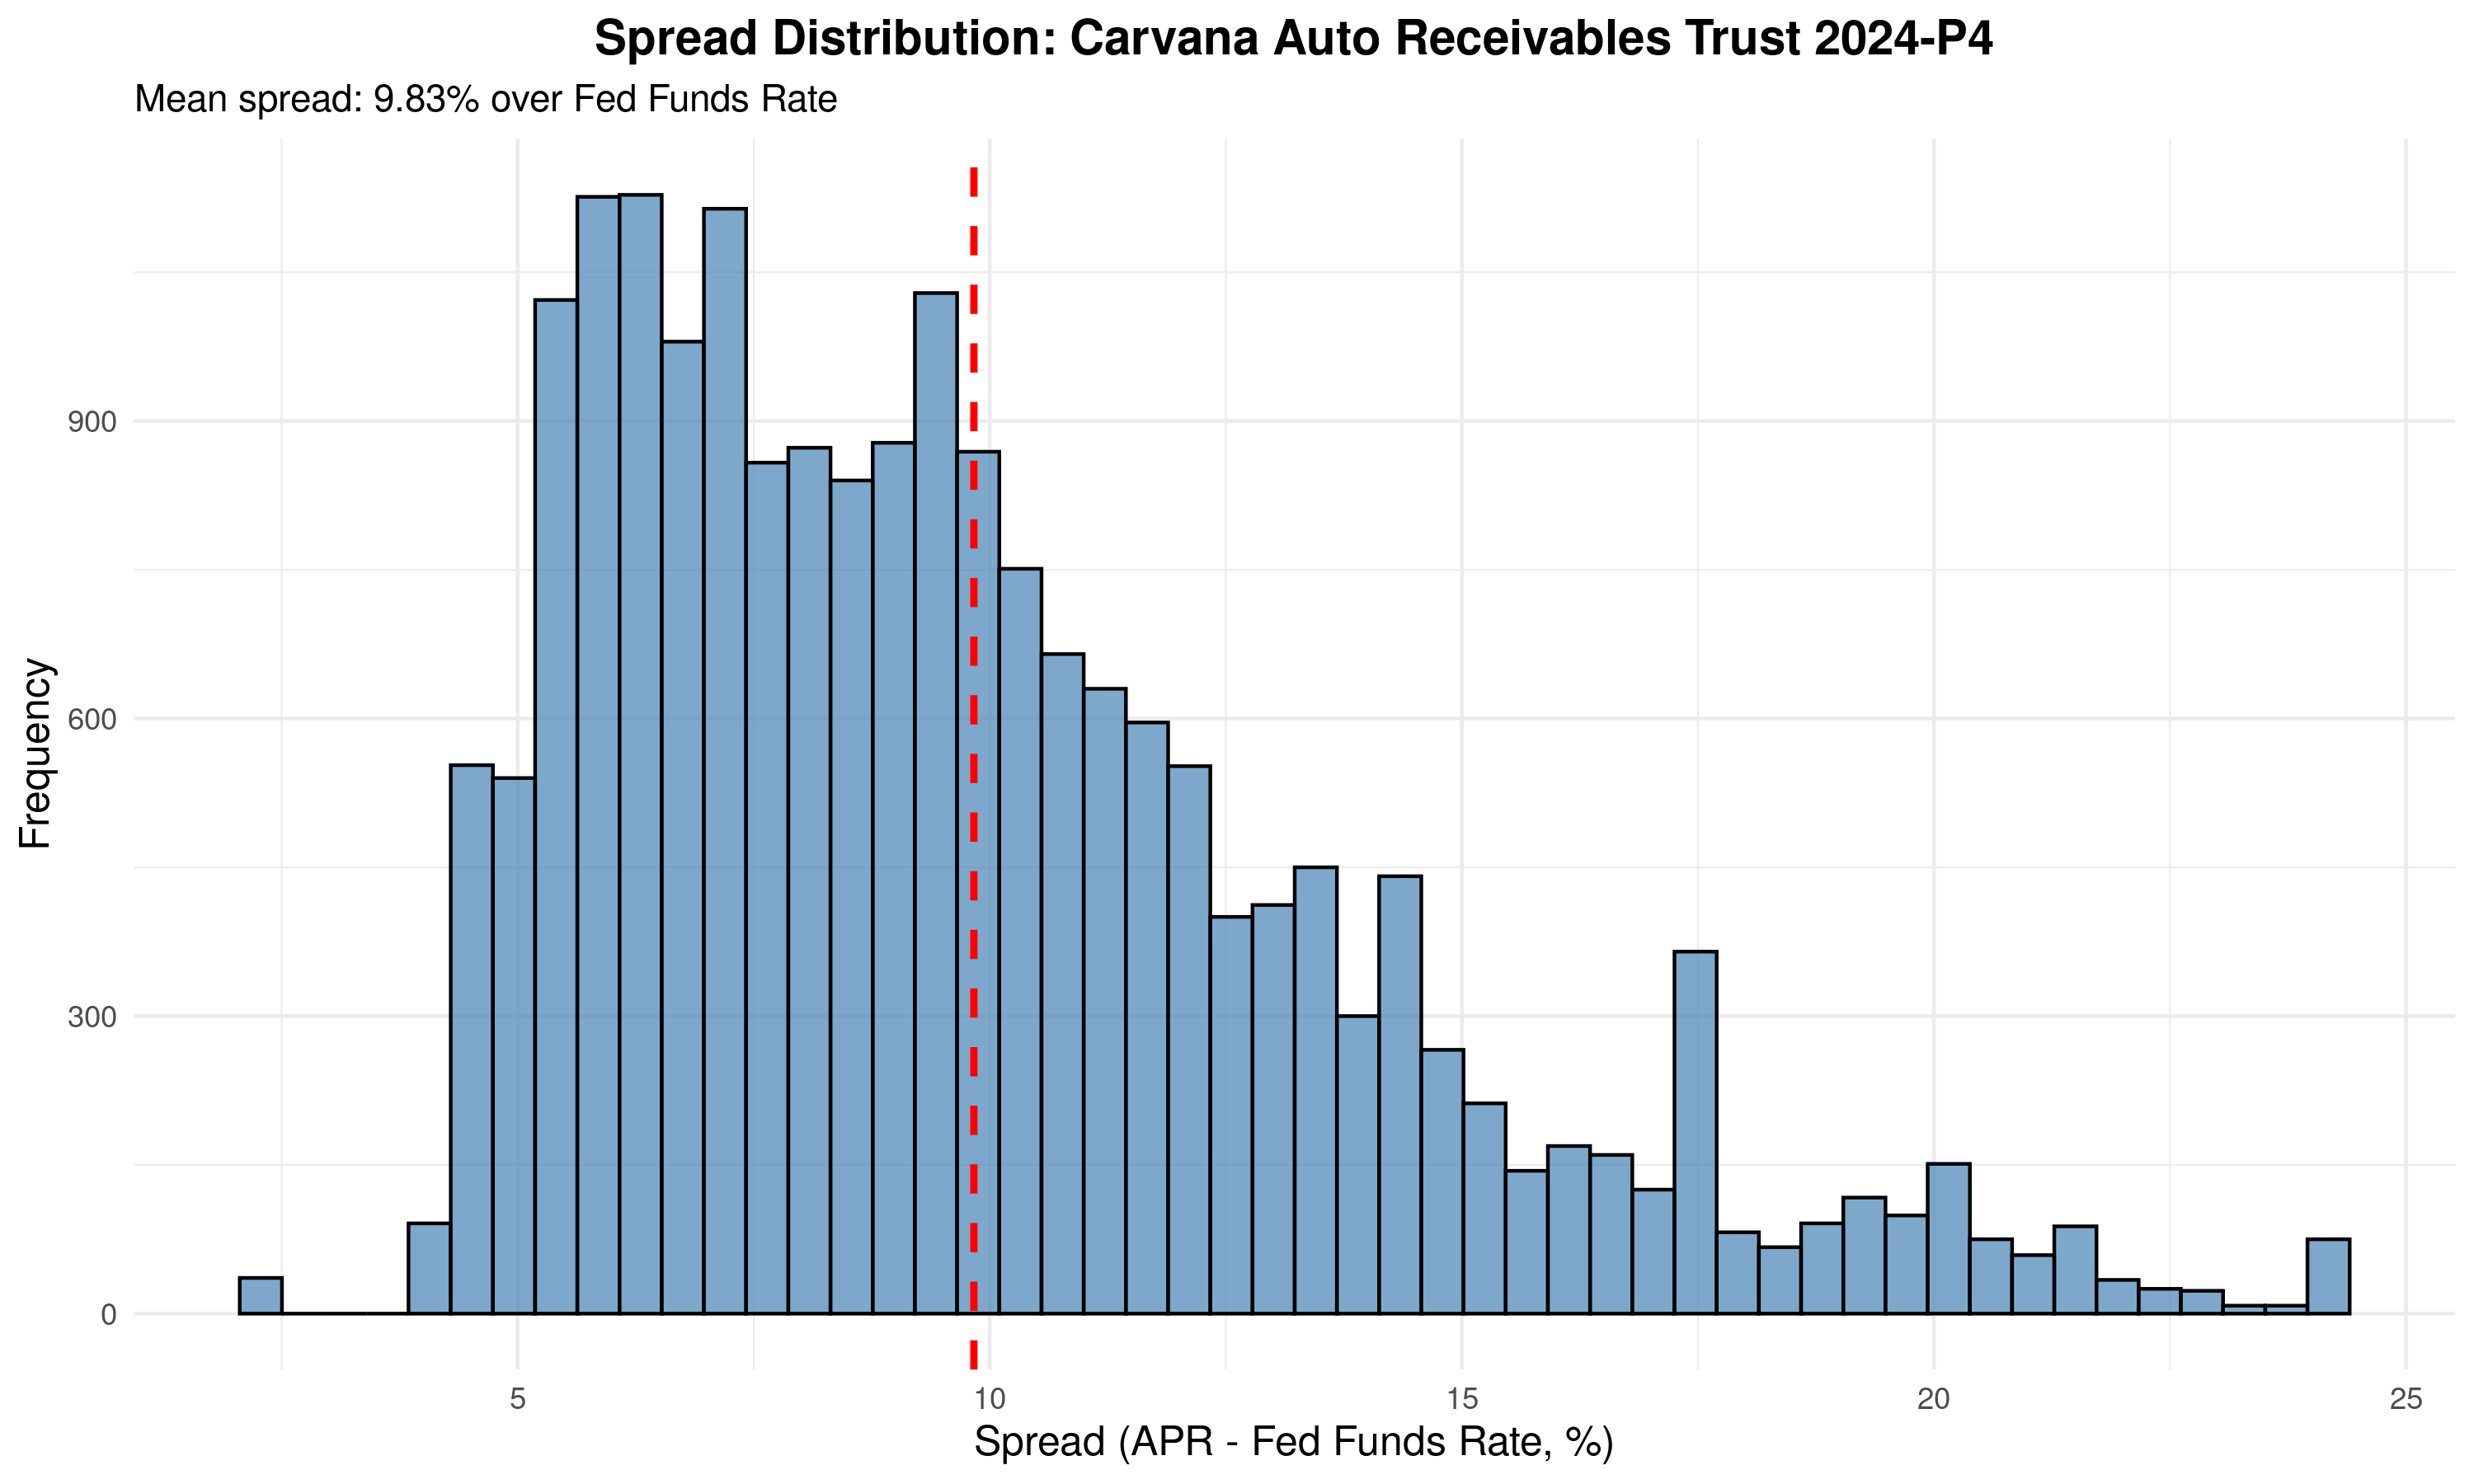
Spread distribution for 2024-P4. Mean spread: 9.83% over Fed Funds. The long right tail extends past 20%, with meaningful clusters at 15%, 17%, and even 24%. This is the distribution of a mixed-credit portfolio marketed as prime.
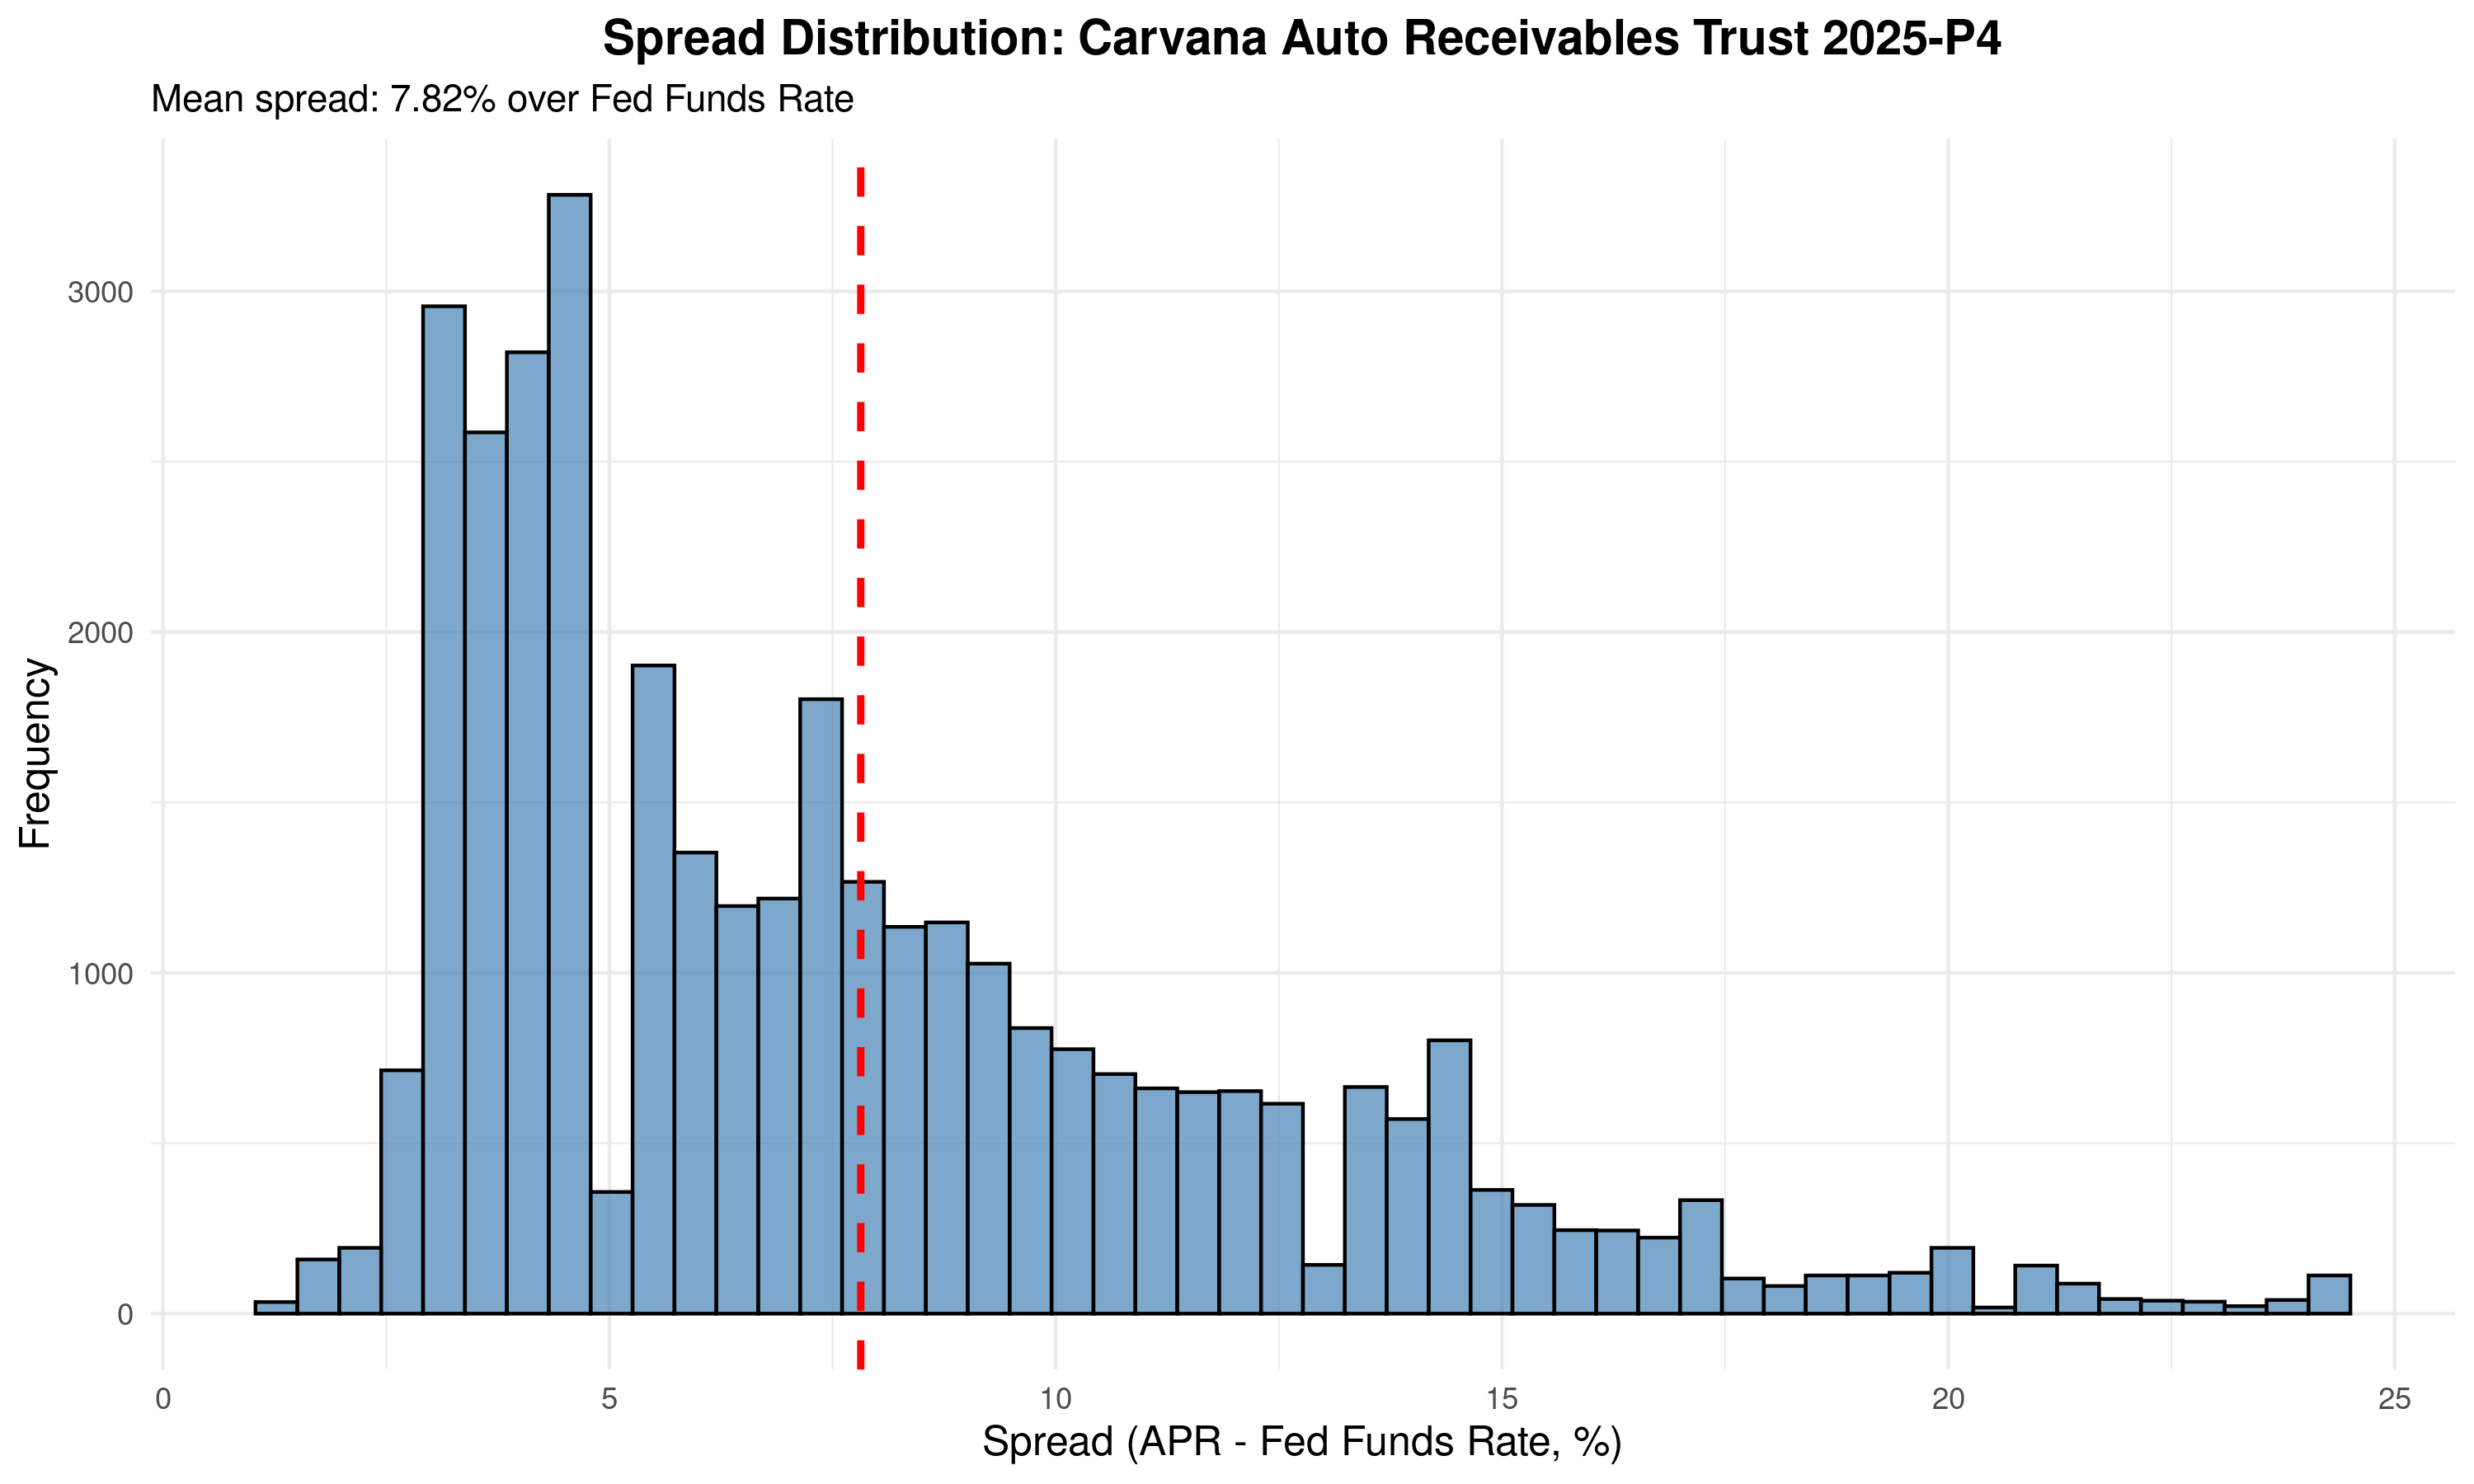
By 2025-P4, the mean spread dropped to 7.82% as competition returned — but the right tail persists. A substantial share of borrowers are still paying 12-20% over Fed Funds despite being in a pool with an average FICO of 706. These are not prime spreads. They are subprime spreads assigned to borrowers with prime scores.
The mean spread compression from 9.83% to 7.82% between 2024-P4 and 2025-P4 looks like improvement. In one sense, it is — Carvana can no longer charge quite as aggressively as banks and credit unions have re-entered the market. But the long right tail tells a different story. Even in the most recent pool, a meaningful share of borrowers are paying spreads of 15-25% — spreads that no prime borrower with alternatives would accept. The tail is the tell: it reveals the hidden-risk borrowers who keep the average FICO high while accepting rates that price in the credit risk their scores don’t reflect.
The R² Collapse: FICO Stopped Predicting Pricing
To measure how thoroughly the relationship between credit scores and pricing broke down, we computed R² — the coefficient of determination — between FICO scores and APR spreads for every Carvana vintage. Carvana’s own 2021-2022 vintages provide the baseline: R² averaged 0.50-0.60, meaning FICO scores explained more than half of pricing variance — consistent with credit scores being the dominant input to rate-setting. When R² drops well below that baseline, it means the lender is pricing on factors other than creditworthiness — factors that don’t appear in the loan tape and can’t be evaluated by ABS investors.
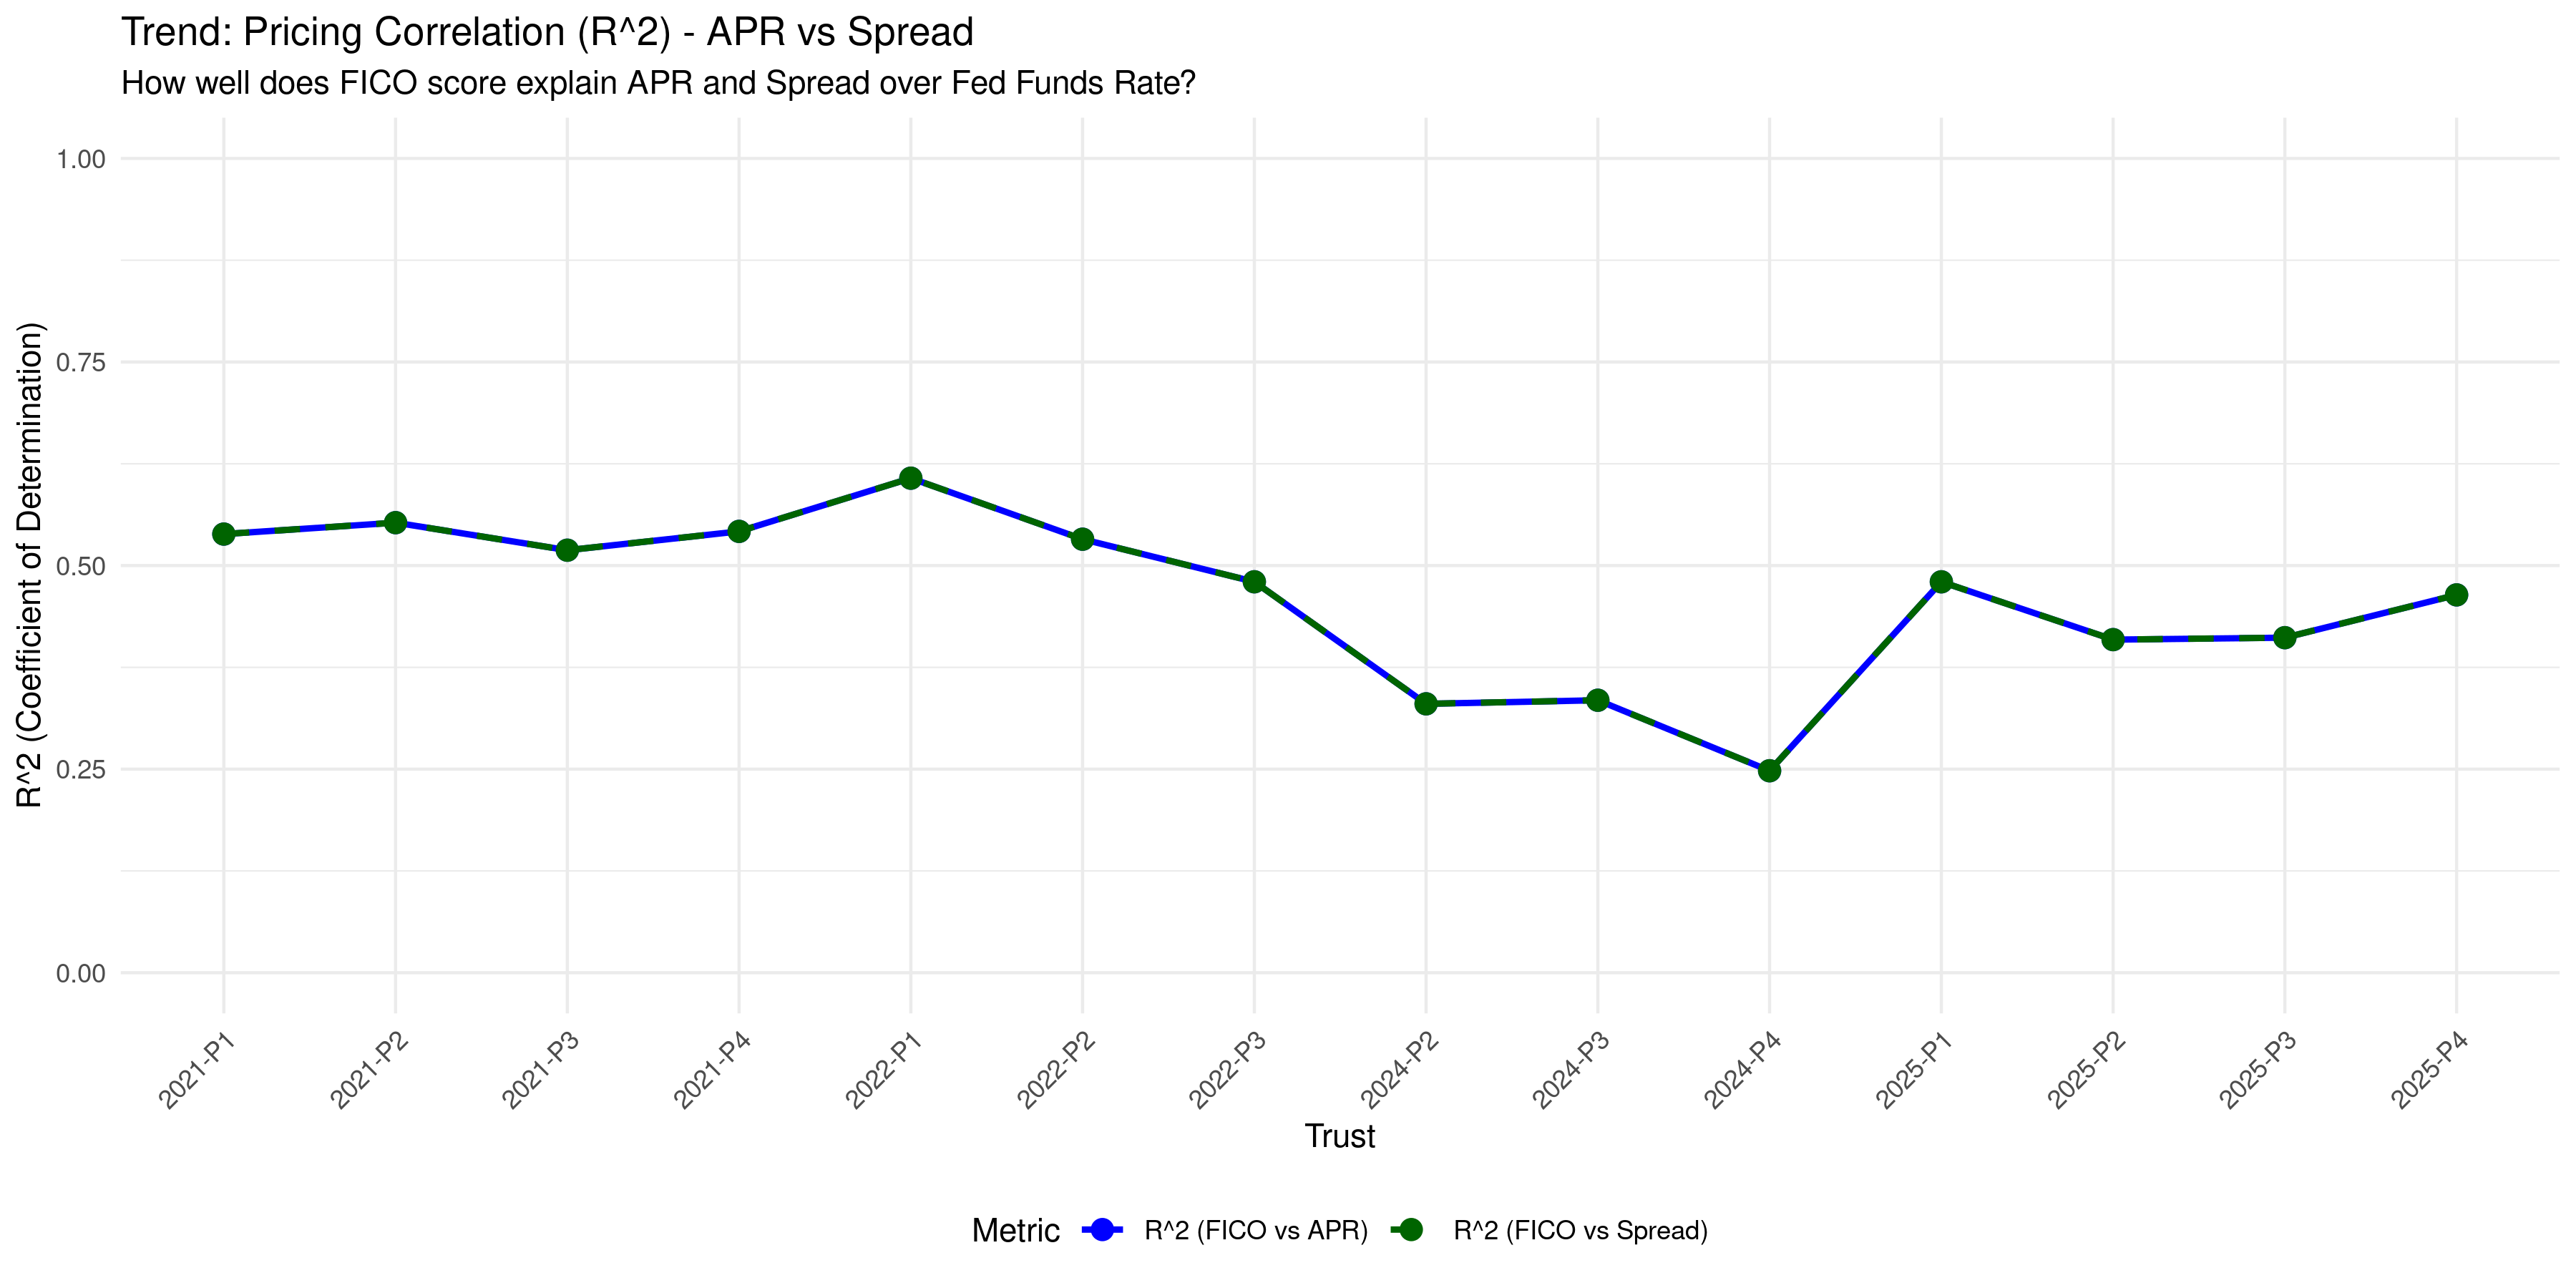
R² between FICO and APR/Spread by vintage. The 0.50-0.60 baseline established in 2021-2022 collapsed to 0.25 by 2024-P4 — meaning FICO scores explained barely a quarter of pricing variance. The other 75% was determined by factors invisible to anyone reading the loan tape.
This is the statistical fingerprint of the strategy described above. Carvana prices on hidden risk factors — factors that justify high rates to the borrower but that don’t appear in the ABS disclosures. The FICO score gets the loan into a “prime” pool. The spread extracts the premium that the hidden risk demands. And the investor, looking at average FICO and average PTI, sees a prime portfolio.
The partial recovery to R² of 0.40-0.47 in 2025 doesn’t indicate a return to sound underwriting. It reflects the mechanical effect of adding borrowers at both extremes of the FICO range — a wider credit score distribution mathematically improves correlation even if the underlying pricing model hasn’t changed. The scatter plots make this clear.
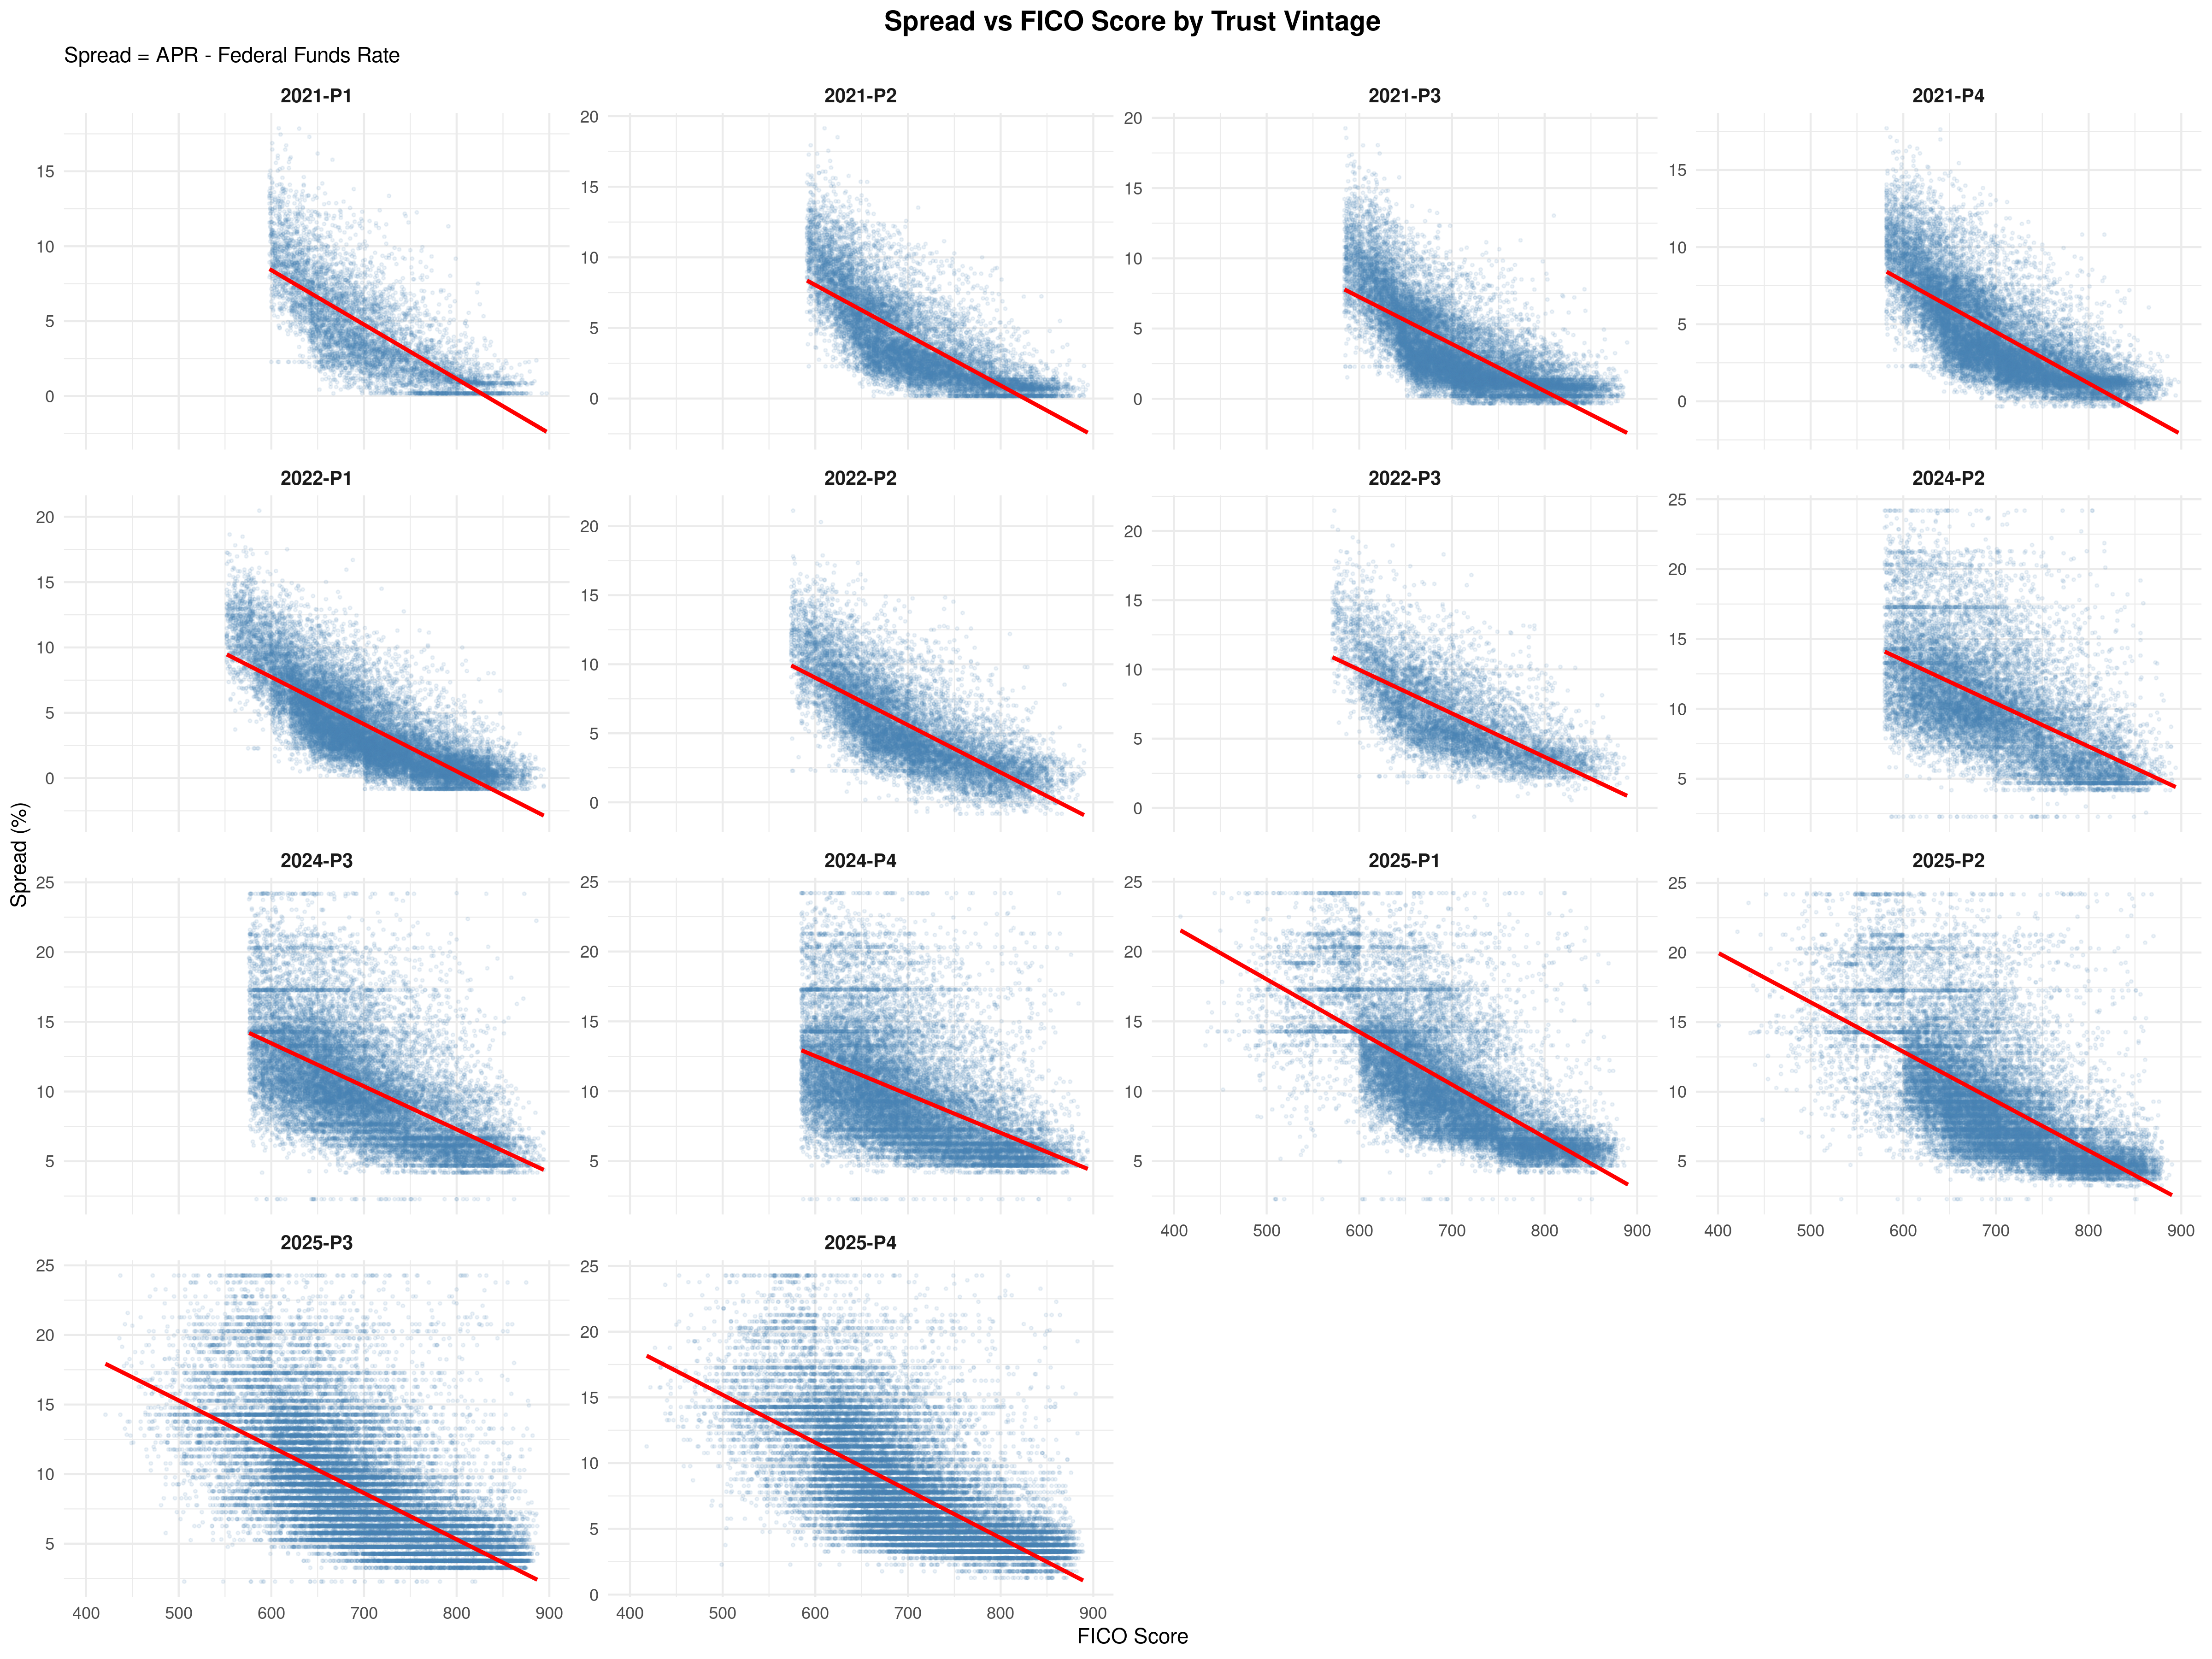
Small multiples of FICO vs. Spread for each vintage. In 2021-2022, the data forms a tight, downward-sloping cloud — higher FICO, lower spread, exactly as risk-based pricing predicts. By 2024, the cloud has flattened into a horizontal band. Borrowers with FICO scores of 650 and 800 receive similar spreads. The linear relationship has vanished.
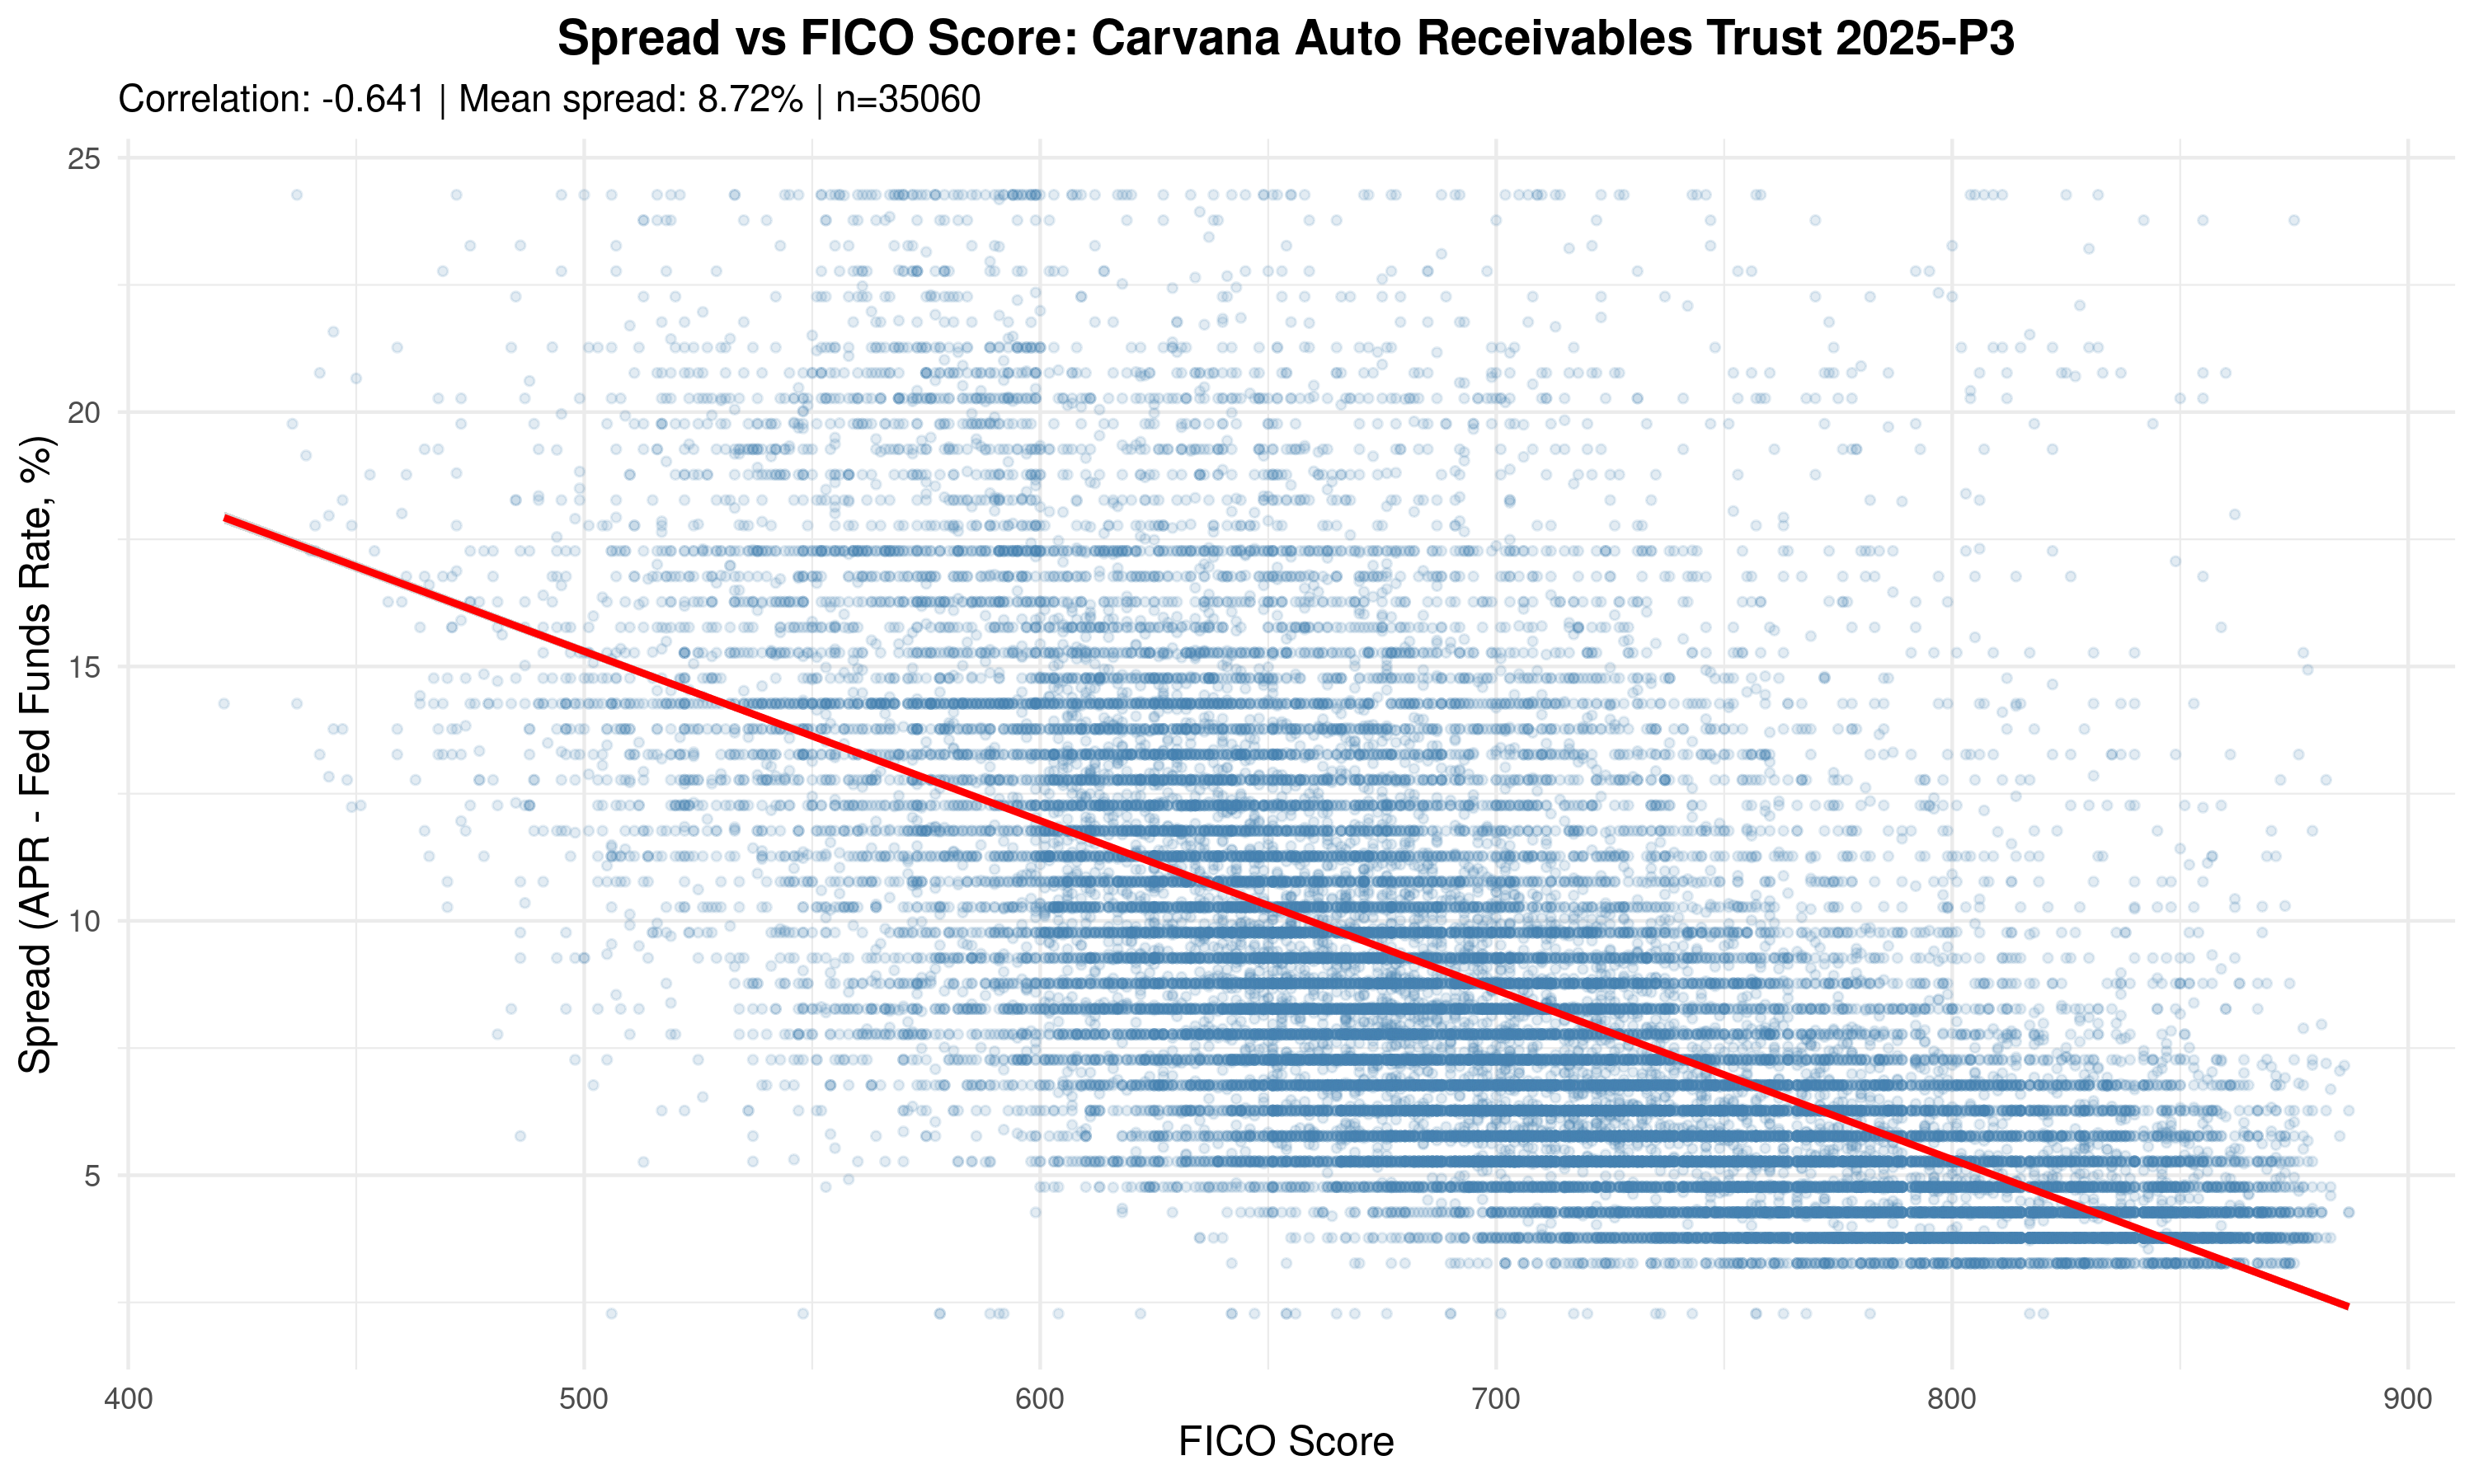
Spread vs. FICO for 2025-P3 (35,060 loans). Correlation: r = -0.641, far weaker than the -0.75 to -0.85 typical of prime auto lending7. Note the distinct horizontal banding — clusters of borrowers at similar spreads despite 200+ point FICO differences. Carvana is slotting borrowers into pricing tiers driven by factors other than their credit scores.
Crossing the Rubicon: The Sub-550 Cohort
Return to the composition chart and focus on the bottom of the bars. The dark red sliver that appears in 2025 represents borrowers with FICO scores below 550 — a threshold that the auto lending industry universally considers deep subprime. Historical default rates for this cohort exceed 40%.3
From 2021-P1 through 2024-P4, Carvana never included these borrowers. Not once. Across ten vintages and nearly 300,000 loans, the sub-550 share was zero. Then in 2025-P1, it appeared at 3.5%, and it has persisted at 3.1-3.3% in every subsequent pool.
This is not a rounding error. In a pool of 34,000 loans, 3% represents roughly 1,000 borrowers. If this cohort defaults at its historical rate of 40%, that produces 400 defaults. At Carvana’s average loan size of approximately $35,000, that’s $14 million in losses from this segment alone — 3.2% of a typical $435 million pool consumed by just 3% of the borrowers. The 2025-P1 subordination level of 14.1% ($61.5 million) provides a buffer, but the sub-550 cohort is not the only source of elevated risk in these pools. It is additive to every other risk factor described in this report, and the buffer is not unlimited.
What This Means for the “Prime” Label
The picture is now precise. Carvana can’t manipulate FICO scores the way it can manipulate stated income. But it doesn’t need to. By engineering the composition of its pools — adding high-FICO borrowers with hidden risk factors at the top, absorbing deep subprime borrowers at the bottom, and charging both groups spreads that no traditional prime lender would touch — Carvana maintains a headline FICO average that supports the “prime” ABS designation while the underlying risk profile diverges further from prime with every new vintage.
The average FICO says 706. The spreads say subprime. One of these numbers is telling the truth.
Pillar 3: The Collateral Illusion
Pillars 1 and 2 showed that Carvana’s credit metrics — stated income and FICO scores — are either unverifiable or actively engineered. But auto lending has a backstop that mortgage lending often doesn’t: the collateral. A car is a physical asset. If a borrower defaults, the lender repossesses the vehicle, sells it, and recovers some or all of the outstanding balance. Even bad underwriting is partially insulated by the value of the car sitting in the borrower’s driveway.
This only works if the car is worth more than the loan. When it isn’t — when the borrower is “underwater,” owing more than the vehicle is worth — the collateral backstop disappears. The lender repossesses a car worth less than the debt, eats the difference, and Loss Given Default spikes from the 20-30% typical of positive-equity auto loans to 60-80%.
Carvana’s average LTV of ~93% is broadly in line with prime auto ABS — the industry average runs in the low-to-mid 90s. On its face, the collateral looks normal. But the average hides something the distribution reveals.
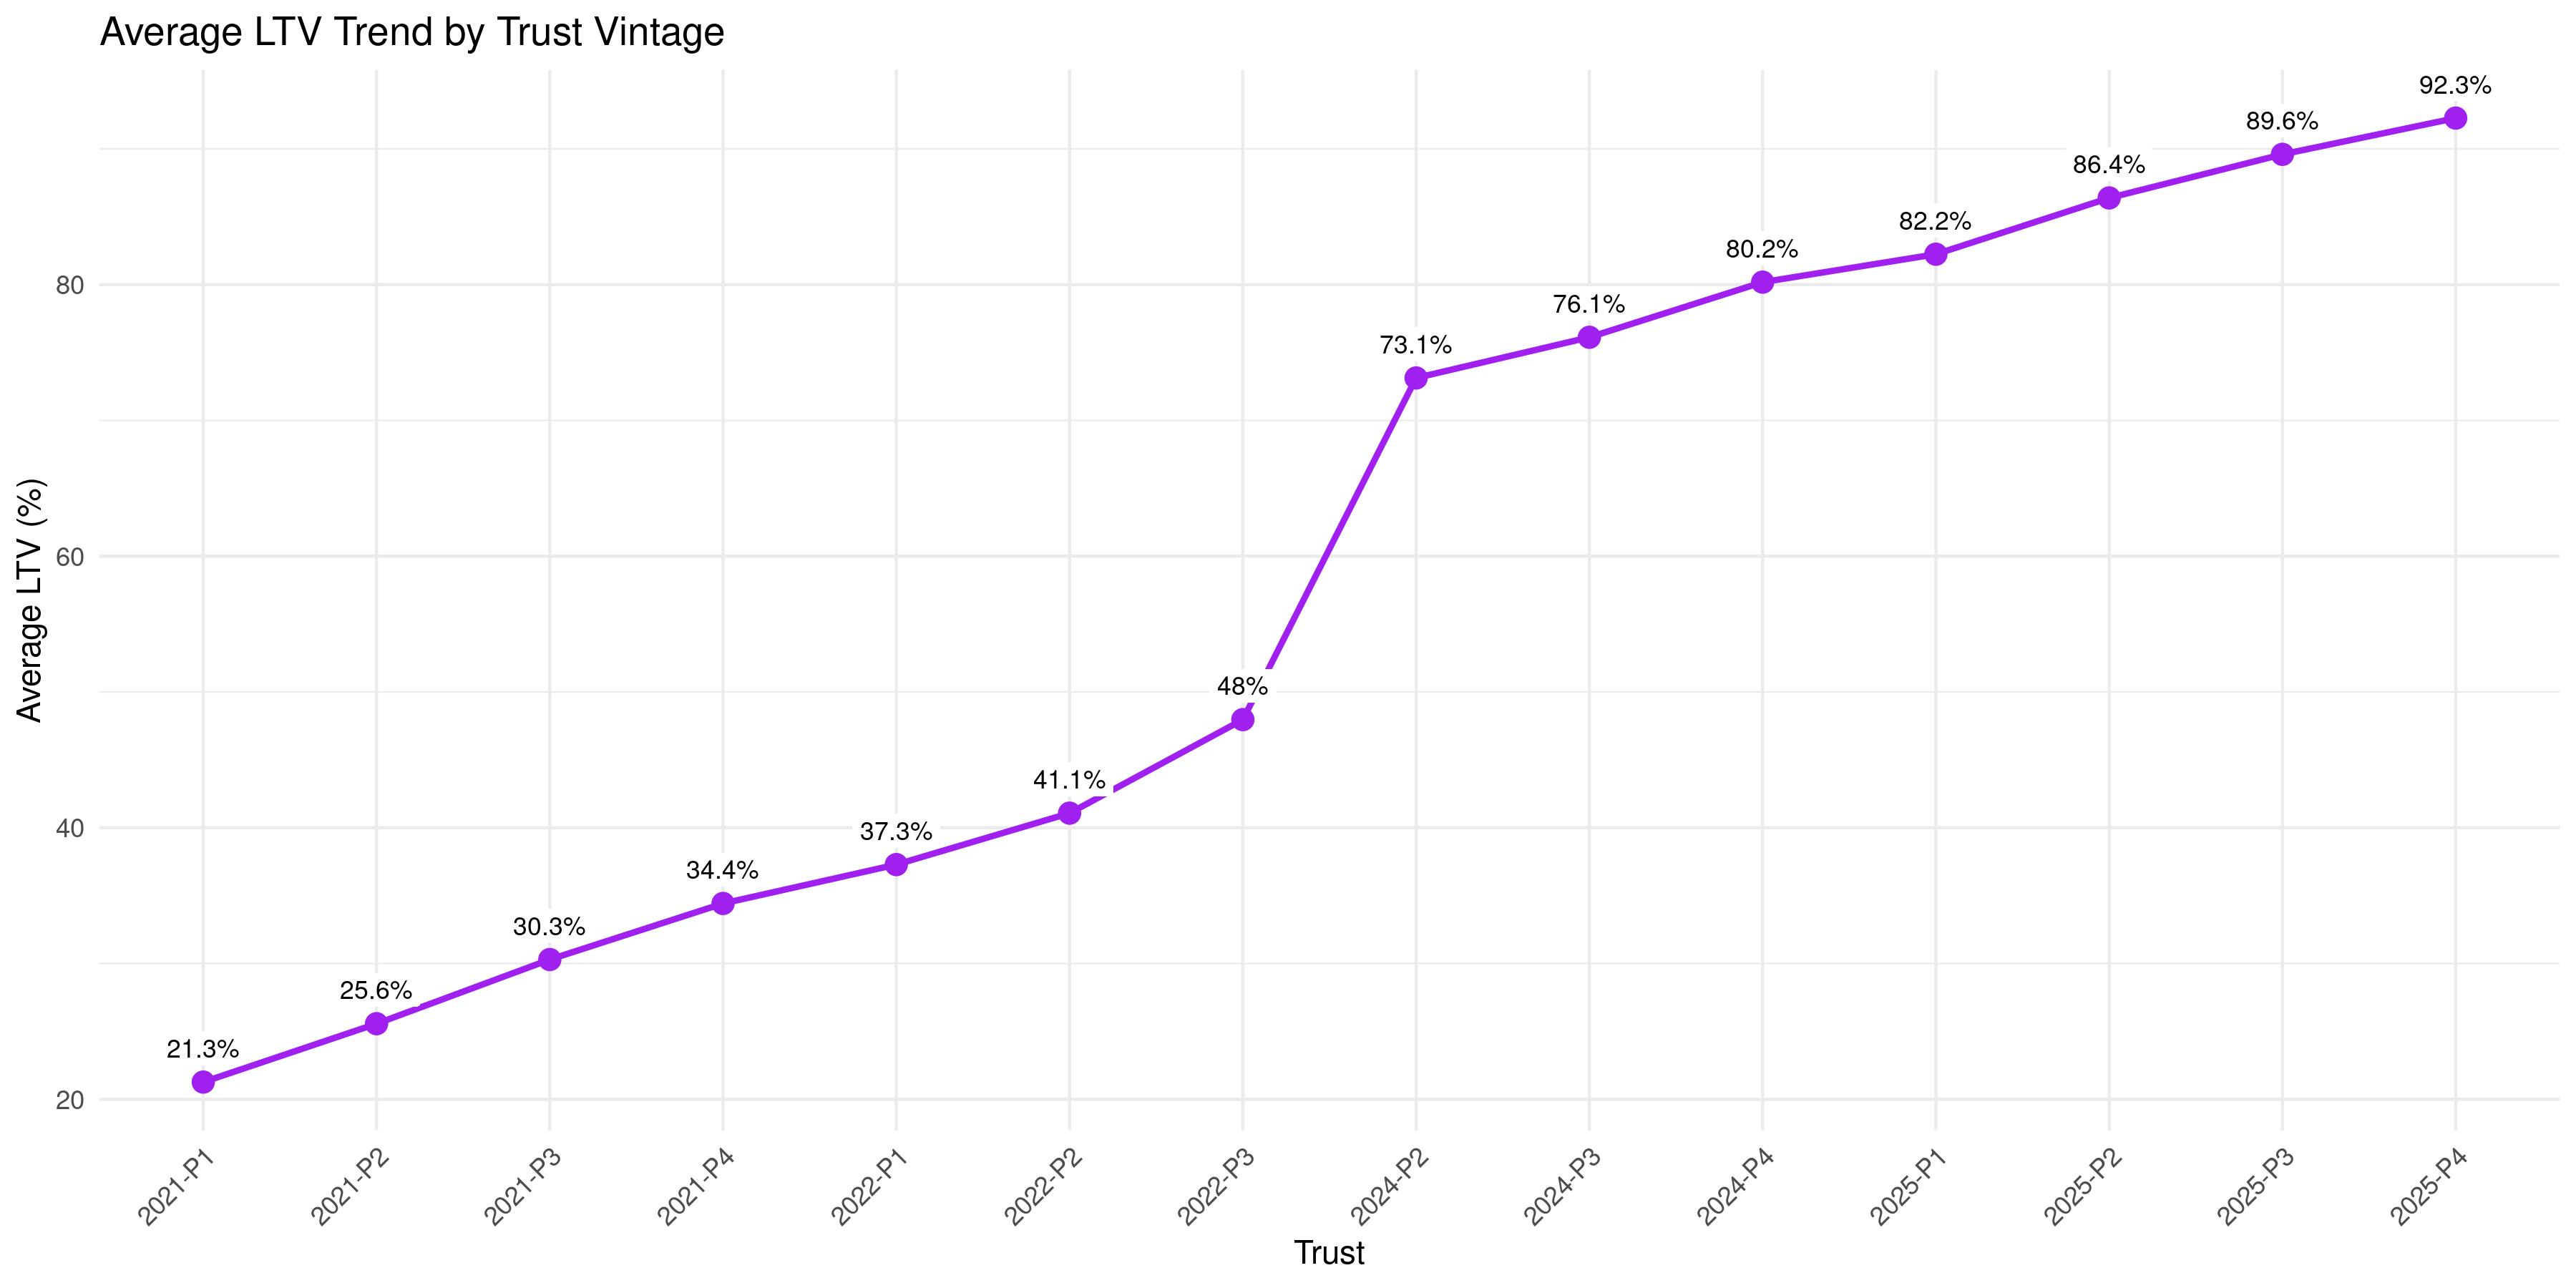
Average Loan-to-Value ratio at origination by trust vintage. LTV has ranged from 88-94% across Carvana’s vintages — broadly in line with prime auto ABS averages. The dip to 87.7% in 2022-P2 coincides with the peak of the COVID used car price bubble, when inflated vehicle values temporarily padded the denominator. Once prices normalized, LTV returned to its structural level — and has climbed to 94% in the most recent 2025 vintages. The average looks normal. The distribution does not.
At first glance, this chart looks unremarkable. The dip in 2022 reflects the COVID-era used car price bubble temporarily inflating vehicle values. The 2024 vintages reverted to 90-92%, and the 2025 vintages have pushed further to 93-94% — the highest levels in company history.
But average LTV is a misleading metric for the same reason that average FICO is: it hides the distribution. An average of 93% is consistent with most borrowers sitting at 85-95% LTV and a small tail above 100%. It is also consistent with a bimodal distribution where a large share of borrowers cluster right at the underwater threshold while others sit well below it. In Carvana’s case, it’s the latter — and the tail above 100% is enormous.
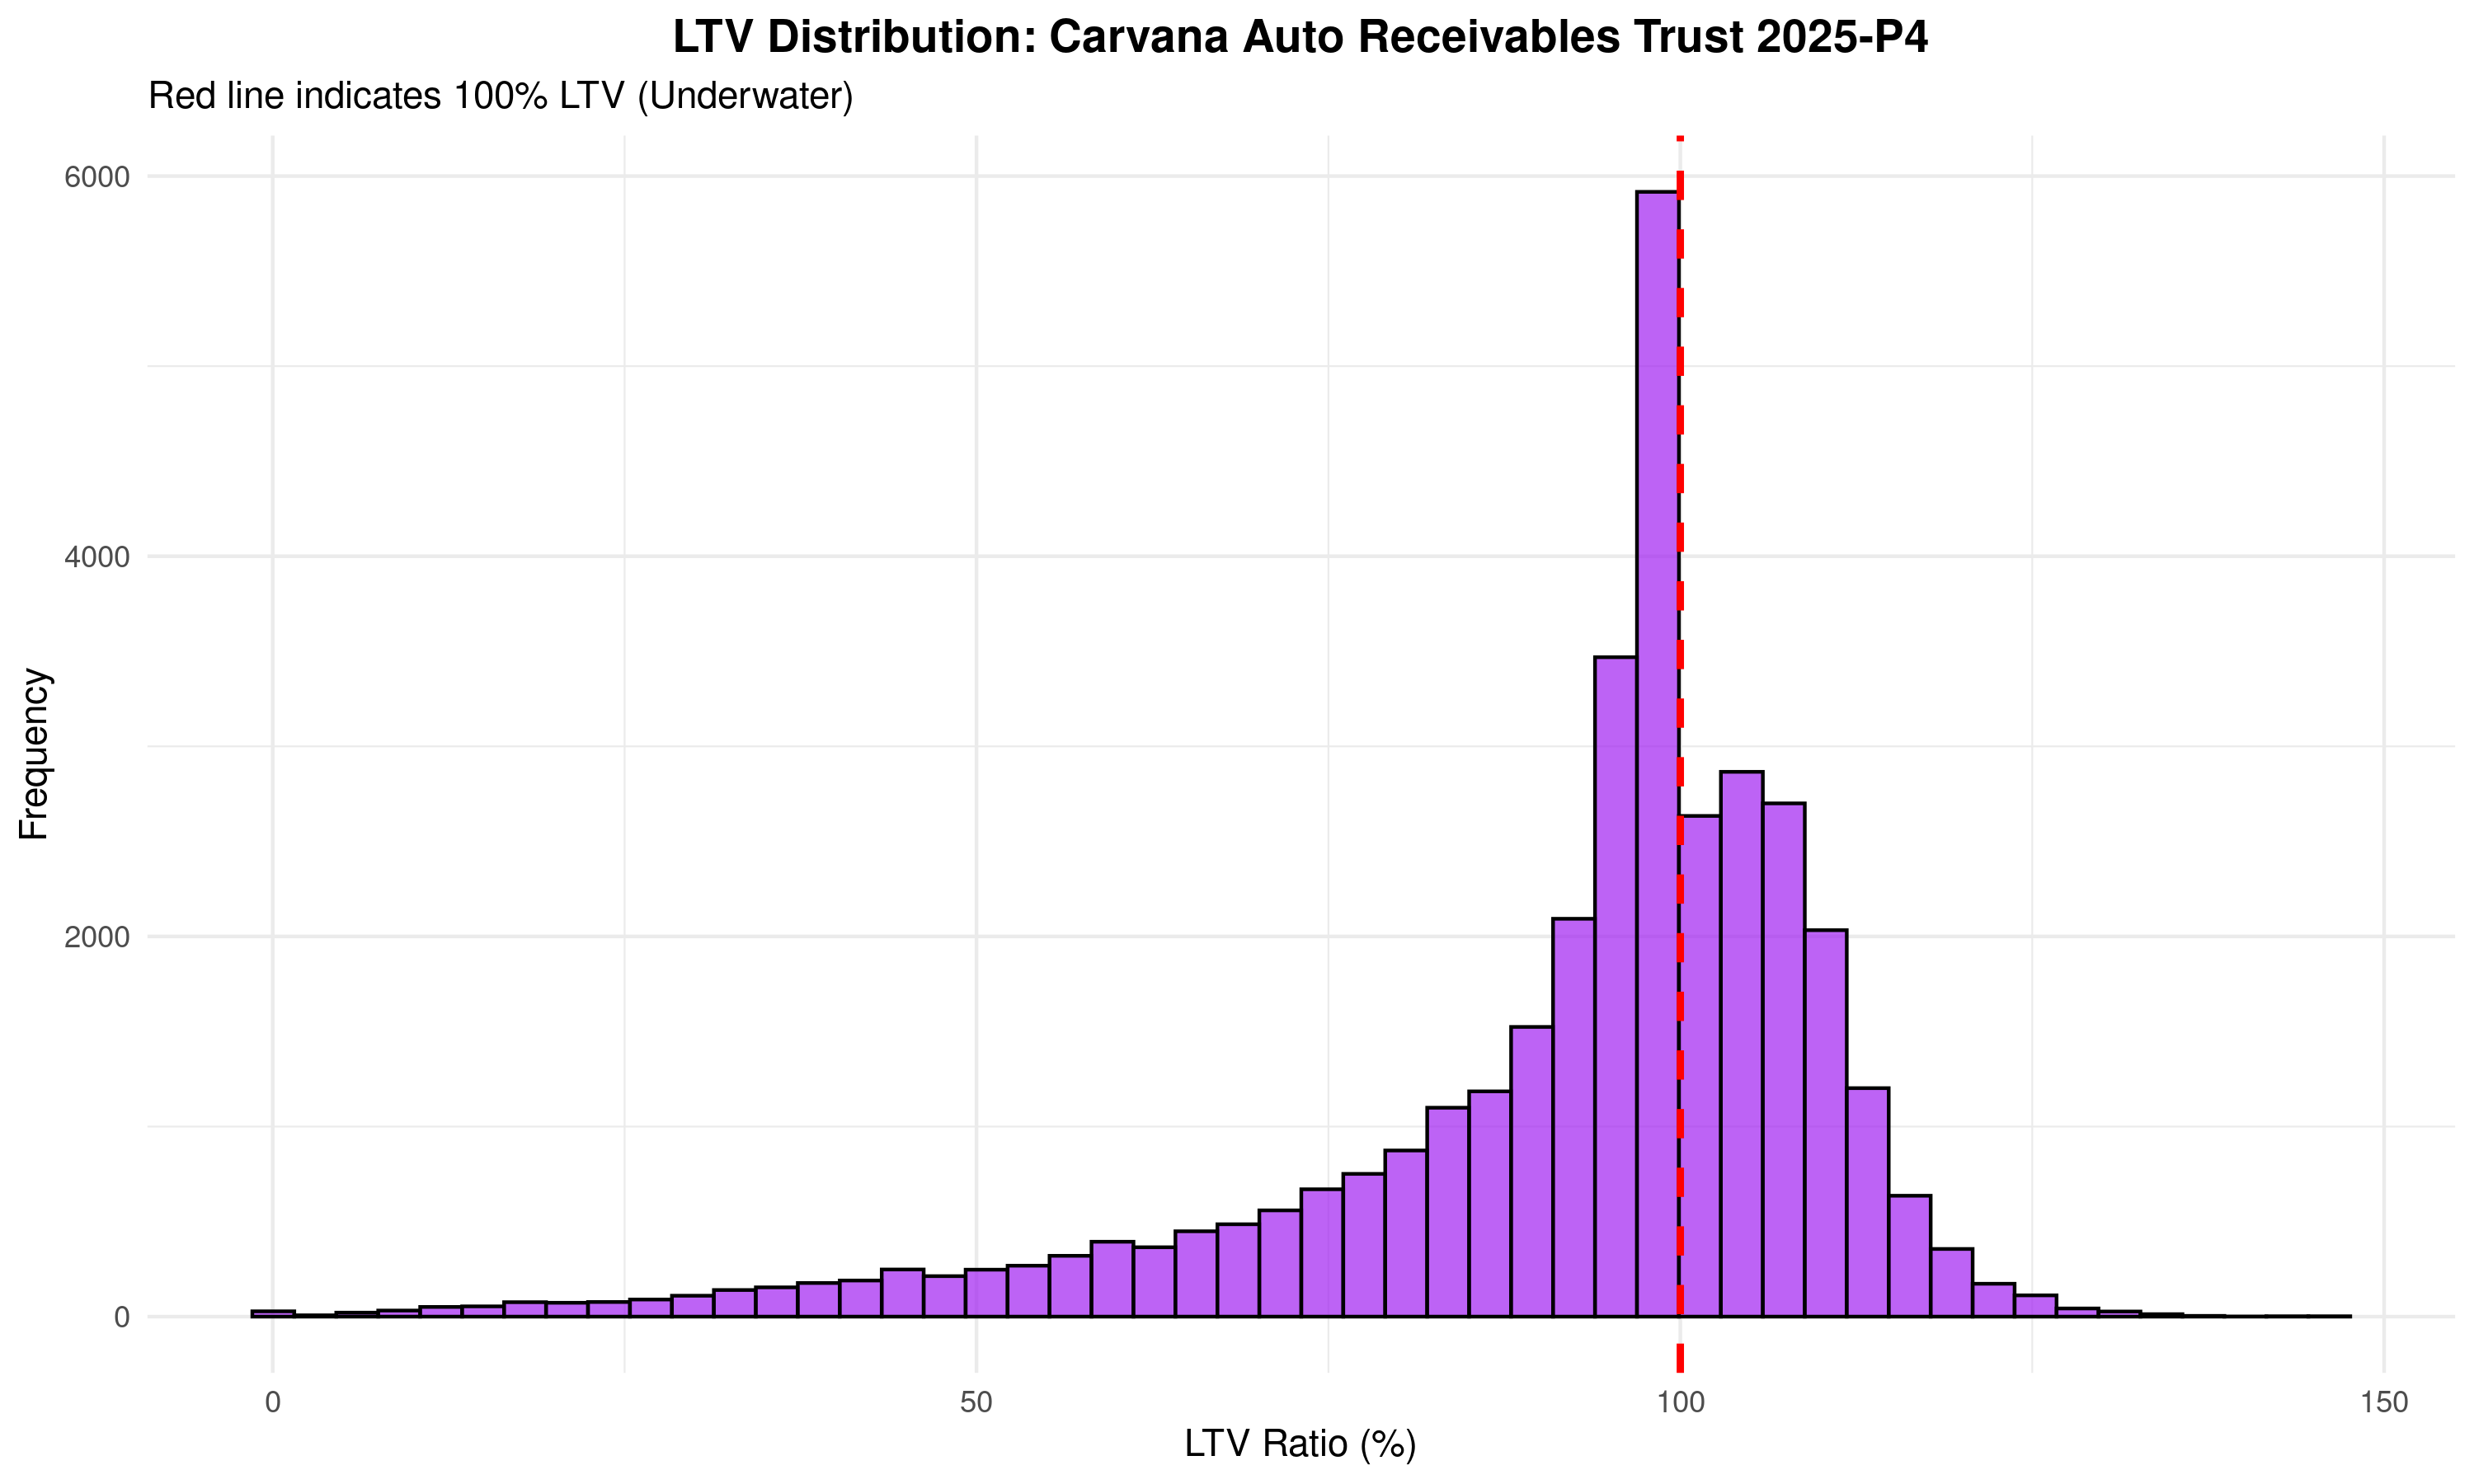
LTV distribution for 2025-P4 (33,943 loans). The red dashed line marks 100% LTV — the underwater threshold. The distribution peaks sharply at 95-100%, with a significant tail extending above 110% and some loans exceeding 130%. The modal borrower is right at the edge. The tail borrowers are deeply, structurally underwater with no prospect of positive equity for years.
The histogram makes the problem visible. The distribution is not centered neatly below 100% with a small tail above it. It is piled up against the underwater threshold, with the tallest bar at 95-100% — thousands of borrowers one month of depreciation away from negative equity. And 39% of the pool is already past the red line, including borrowers at 110%, 120%, even 130%+ LTV. For these borrowers, the gap between what they owe and what their car is worth is thousands of dollars — and it is widening every month as the vehicle depreciates.
How unusual is this? A 2024 CFPB study found that only 8-17% of auto loans across the entire industry — including subprime — are originated with negative equity.1 The FDIC has explicitly characterized routine origination above 100% LTV as a feature of subprime portfolios.8 In Q4 2025, 29.3% of trade-ins toward new-vehicle purchases had negative equity — the highest share since Q1 2021, and widely reported as a sign of deepening auto loan stress.9 Carvana’s pools have exceeded even that elevated benchmark in every single vintage the company has ever issued.
And this is not a recent development.
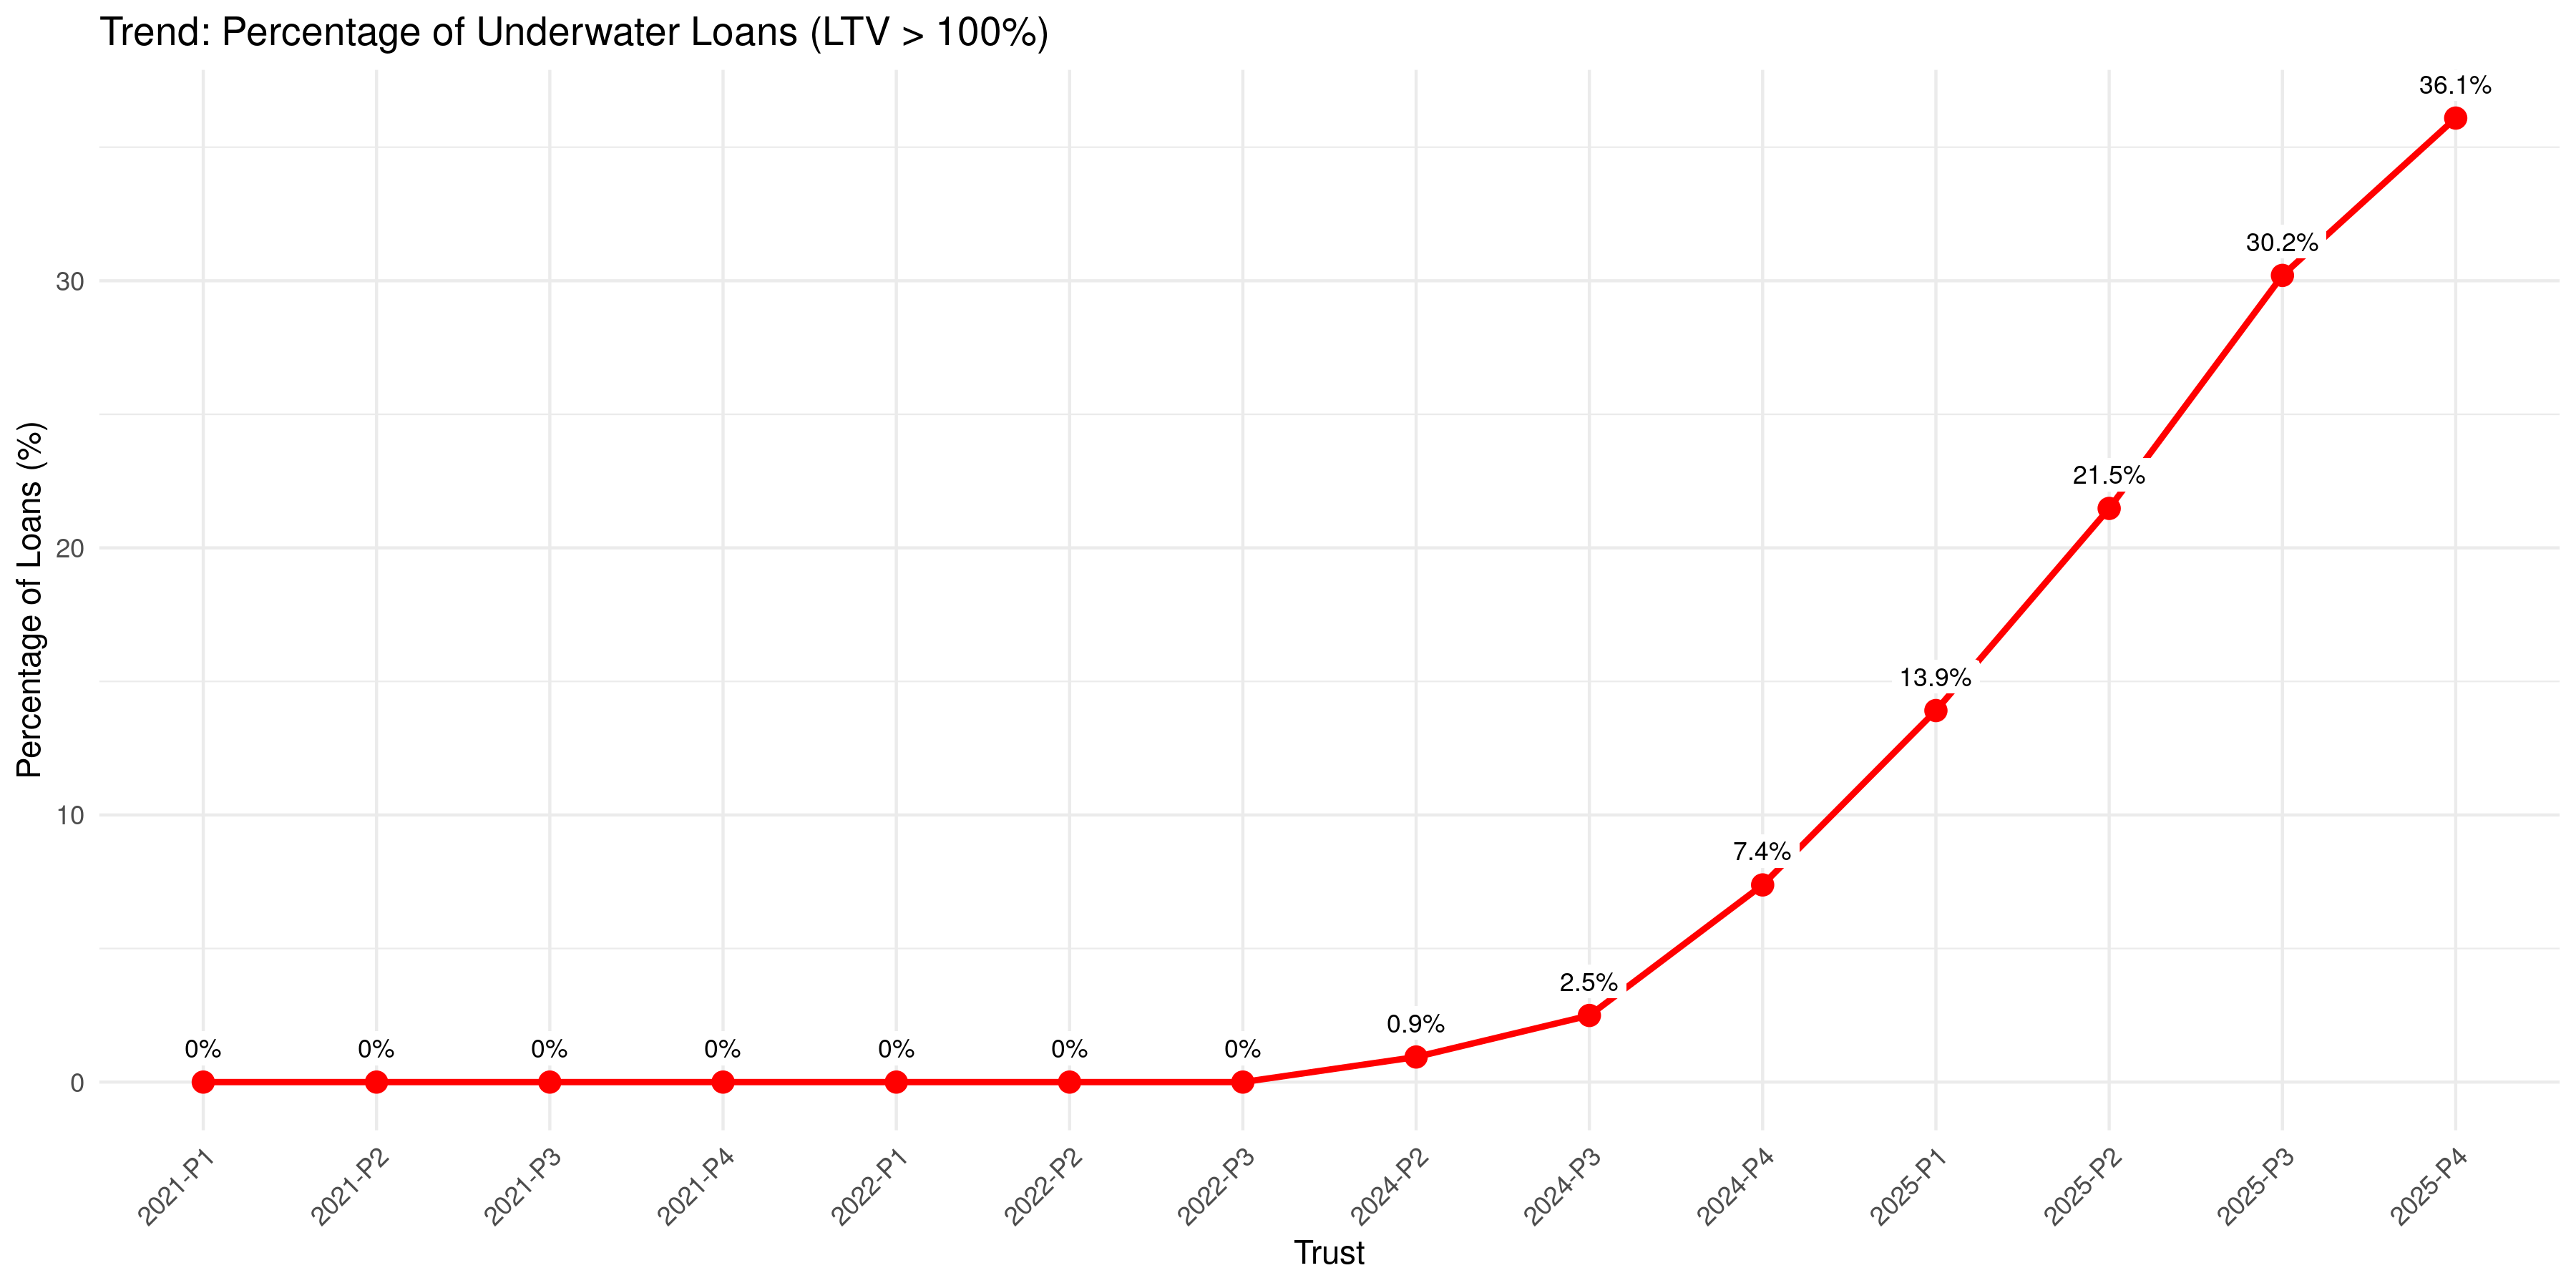
Percentage of loans originated with LTV > 100% (underwater at origination) by trust vintage. Across every Carvana vintage, roughly 27-39% of loans have been underwater at origination. The 2022 dip to 26.7% reflects the temporary inflation of used car prices during the COVID supply shock, not a change in underwriting standards. Once prices normalized, the underwater share returned to its structural range of 30-39%.
In Carvana’s very first pool — 2021-P1, originated during the company’s “golden age” — 37.1% of loans were underwater at origination. In the most recent pool, 2025-P4, the figure is 38.9%. The number barely changed. It has always been this way.
The 2022 dip to 26.7% was not the result of better underwriting. It coincided exactly with the peak of the COVID-era used car price bubble, when a vehicle bought for $25,000 might have been worth $28,000 at auction simply because of the supply shortage. That windfall compressed LTV ratios and reduced the underwater share mechanically — not because Carvana changed what it was doing, but because the denominator temporarily inflated. When prices normalized, the structural reality returned.
What Happens to Underwater Borrowers
These borrowers have negative equity from day one. Their cars will depreciate 15-20% in the first year and another 10-15% in the second. Their loan balances, meanwhile, amortize slowly — especially with the term extensions Carvana has been pushing.
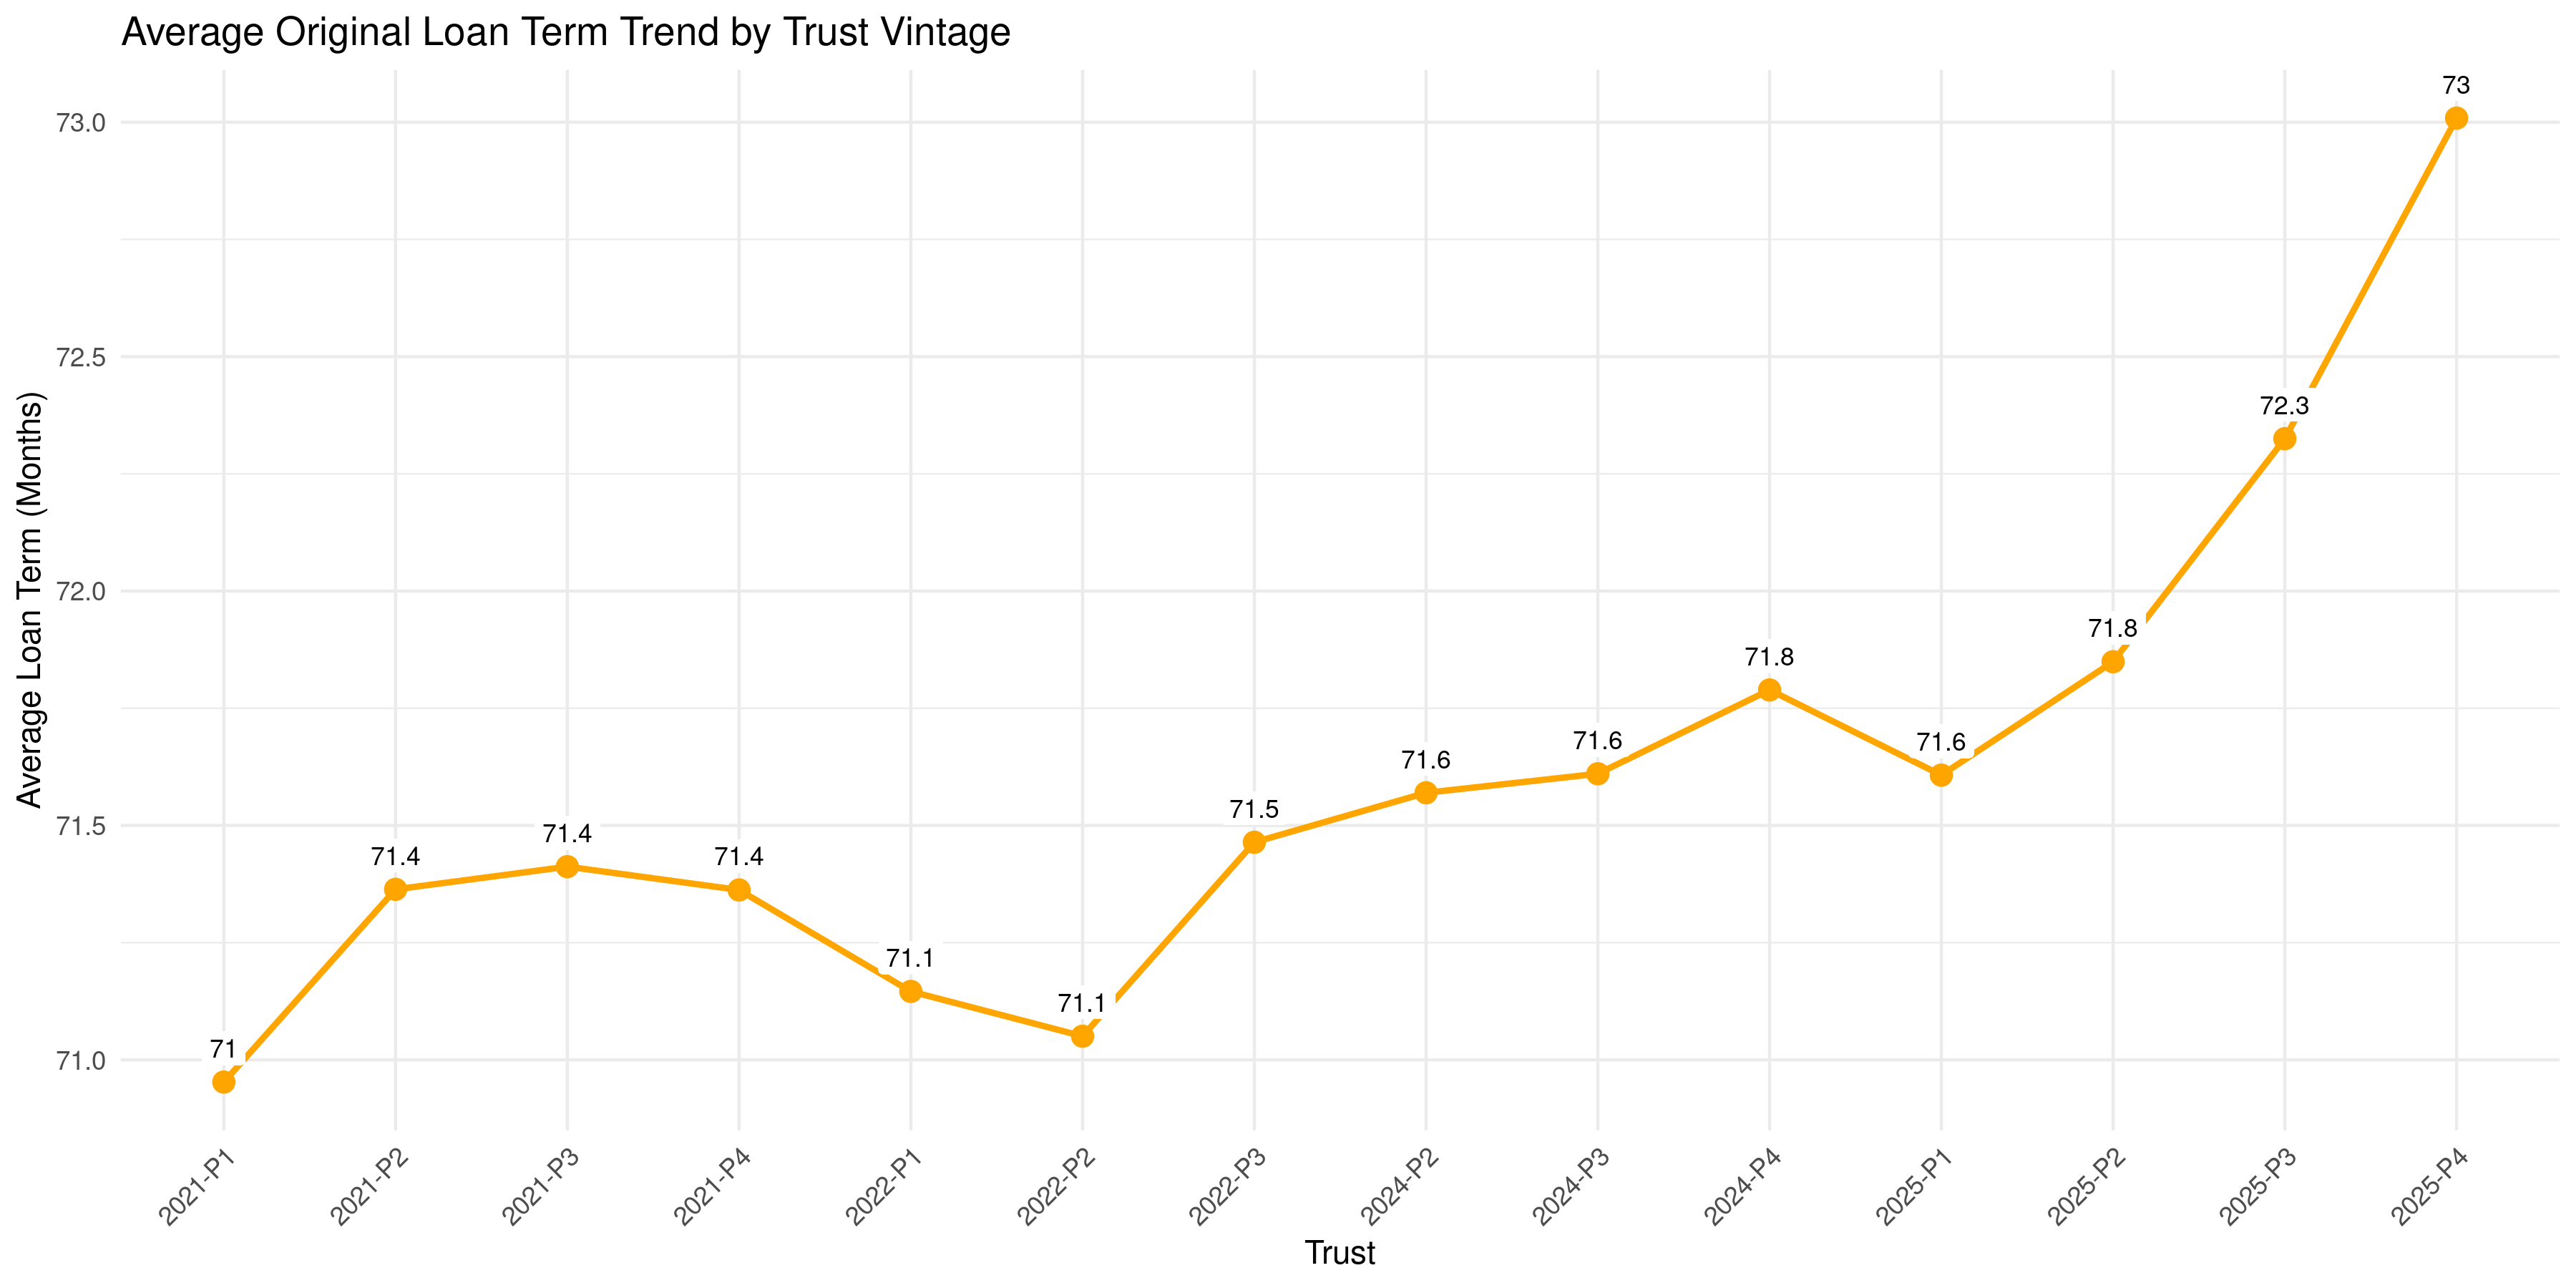
Average original loan term by trust vintage. Terms crept from 71.0 months in 2021-P1 to 73.0 months in 2025-P4. Two months may sound trivial. On a depreciating asset, it is not — it pushes the “equity inflection point” (the month when the borrower’s loan balance finally dips below the car’s depreciated value) further into the future, ensuring that underwater borrowers stay underwater longer.
The term extensions and LTV levels compound each other. A borrower who starts at 105% LTV with a 73-month term is in a worse position than one at 105% LTV with a 60-month term, because the shorter term pays down principal faster. Carvana has both levers set to maximum risk: structurally high starting LTVs and slow amortization. The result is that the equity inflection point gets pushed 18-24 months into the loan’s lifecycle. For the most deeply underwater borrowers, it may never arrive at all.
This matters enormously when something goes wrong. When a borrower with positive equity loses their job, they can sell the car, pay off the loan, and walk away whole. When a borrower at 110% LTV loses their job, they can’t sell the car for enough to cover what they owe. Their options narrow to two: keep making payments they can no longer afford, or stop paying and let Carvana repossess a vehicle worth less than the debt. The rational choice — the economically optimal move — is to default.
The Loss Math
The numbers are stark. In 2025-P4 alone, roughly 13,200 of 33,943 loans were originated underwater. If 10% of these borrowers default — a conservative assumption given that they have no equity cushion and many fall into the high-spread, hidden-risk cohort identified in Pillar 2 — that produces 1,320 defaults.
On a positive-equity auto loan, Loss Given Default runs 20-30%: the lender repossesses, sells the car, and recovers most of the balance. On an underwater loan, the math inverts. The lender repossesses a car worth less than the debt, sells it at auction for whatever the market will bear, and eats the rest. LGD on these loans runs 60-80%.
At an average loan balance of roughly $35,000 and an LGD of 70%, each underwater default costs the trust approximately $24,500 — compared to roughly $8,750 for a positive-equity default. The same number of defaults produces nearly three times the dollar losses. This is why LTV matters more than default rate for Carvana’s ABS: with a third of the pool underwater at origination, loss severity on defaults is structurally elevated — and has been since the first pool Carvana ever issued.
Pillar 4: Extensions and the Trigger Question
The first three pillars examined what goes into Carvana’s loan pools at origination — stated income, engineered FICO composition, and underwater collateral. This pillar examines what happens after: how Carvana services these loans, and whether the delinquency numbers reported to ABS investors accurately reflect the underlying stress in the portfolio.
We want to be precise about what follows. We are not lawyers, and we are not alleging fraud. What we are presenting is a statistical pattern in publicly available servicer reports — one that we assembled by parsing hundreds of individual Form 10-D filings using an LLM — that we believe warrants scrutiny. The reader should evaluate the evidence and draw their own conclusions.
How Triggers Work
Every Carvana Auto Receivables Trust contains contractual triggers written into the trust indenture that protect ABS investors. The most important is the 60+ day delinquency trigger. If the percentage of loans that are 60 or more days past due exceeds a specified threshold — typically starting around 2.0% and stepping up as the pool seasons — the trust enters “early amortization.” Cash flows that would normally go to Carvana as the residual holder are instead redirected to ABS investors, accelerating principal repayment and protecting their interests.
This safeguard exists precisely for situations like the ones described in Pillars 1-3: when loan quality deteriorates beyond what was anticipated at issuance. A trigger event tells the market something has gone wrong and forces the issuer to prioritize investor protection over its own cash flow.
Early amortization would also be a public signal — visible to every ABS investor, every rating agency, and every equity analyst covering Carvana. For a company whose business model depends on continuous securitization, a trigger event in any trust would be devastating.
How Extensions Work
Carvana, as servicer of its own trusts, has the discretion to grant loan extensions (also called deferrals) to borrowers who are struggling to make payments. Extensions are a standard servicing tool — every auto lender uses them. A borrower who is 60 days delinquent can be granted a one- or two-month extension, which pushes the due date forward and, critically, removes the loan from the 60+ day delinquency count.
This is the mechanical point that matters: an extension doesn’t cure the borrower’s financial distress. It resets their delinquency clock. The borrower still owes the same amount, still has the same income (or lack thereof), and still has the same underwater collateral. But on the servicer report filed with the SEC, they are no longer counted as 60+ days delinquent.
To be clear: there is nothing inherently improper about granting extensions. Servicers do it for legitimate reasons — temporary hardship, job transitions, medical events. The question is not whether extensions are used, but whether the pattern of their use suggests something beyond routine borrower relief.
The Pattern
We analyzed monthly servicer reports (Form 10-D) filed with the SEC for multiple Carvana trusts. For each reporting period, we tracked three metrics: reported 60+ day delinquency (blue line in the charts below), an adjusted delinquency figure that adds back recently extended loans (green line), and the number of extensions granted (gray bars). We then plotted these against the contractual trigger thresholds specified in each trust’s indenture (red dashed line).
Here is what we found.
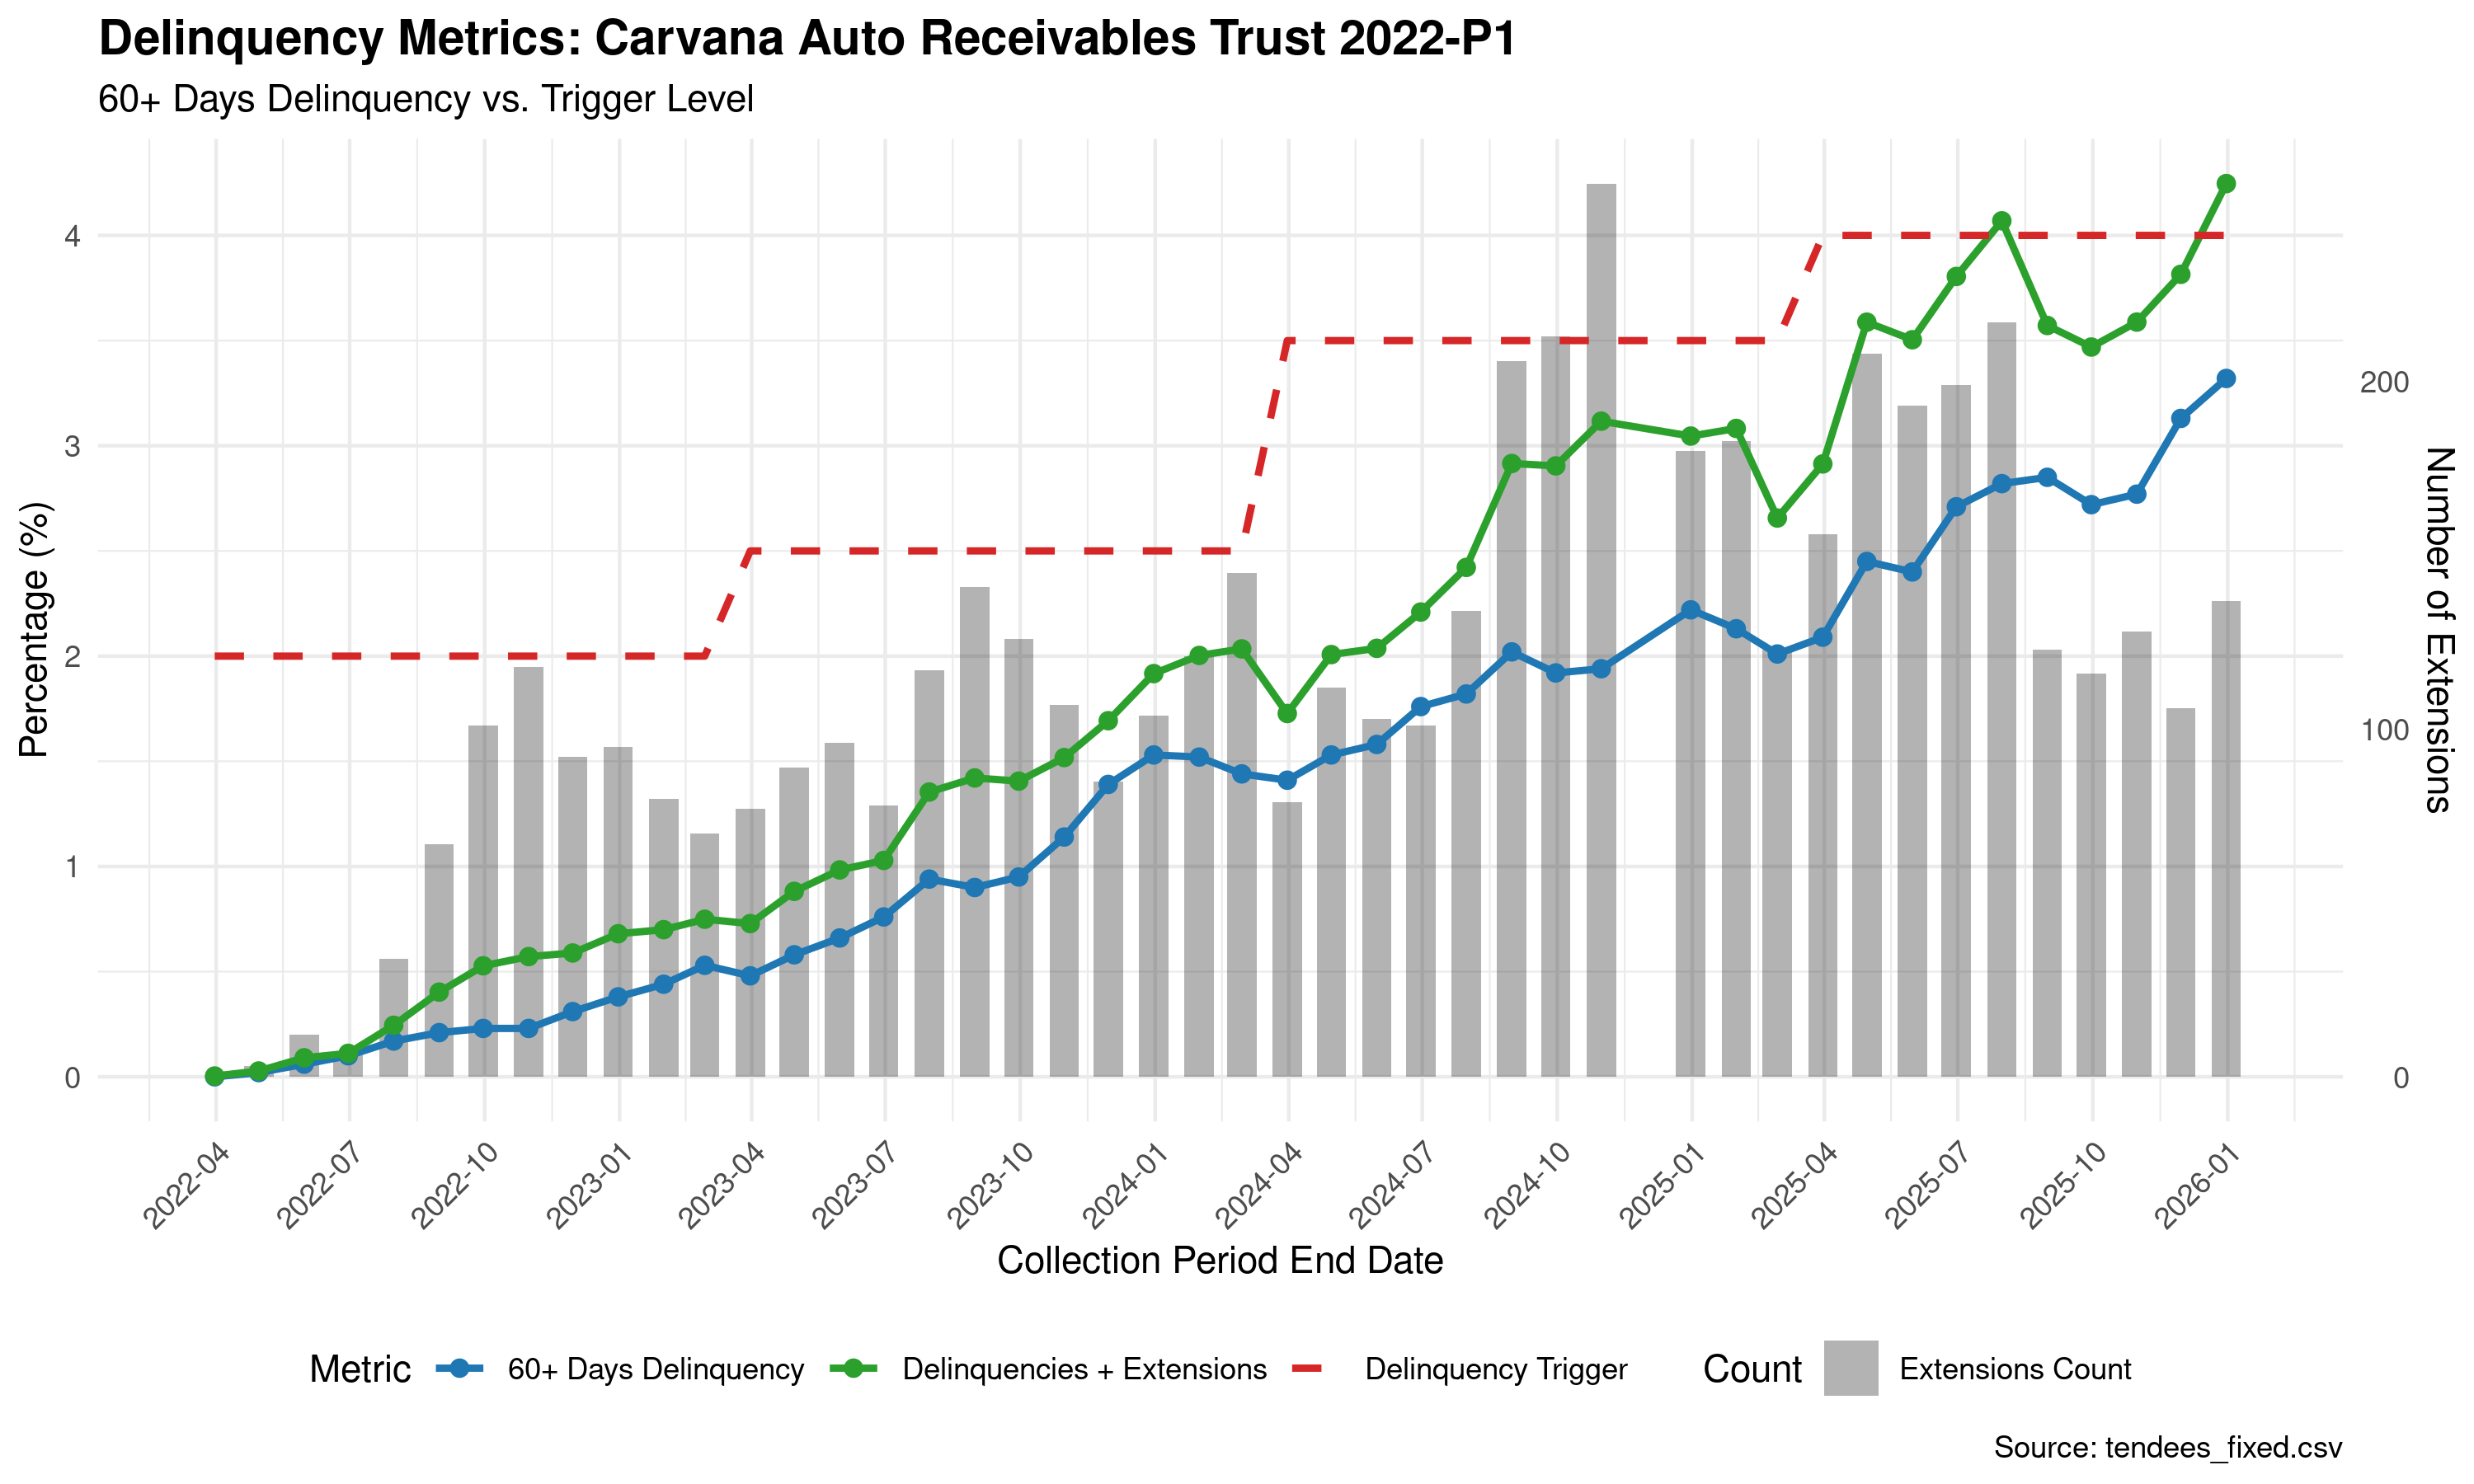
Delinquency metrics for the 2022-P1 trust. Extensions surge to 200+/month in late 2025 as adjusted delinquency (green) reaches 4%+. Reported delinquency (blue) remains below 3.5% while adjusted delinquency climbs to 4.3%. The gap between the two lines widens in lockstep with the extension surge.
The 2022-P1 trust is the most striking example. The trigger threshold steps up from 2.0% to 2.5% to 3.5% to 4.0% as the pool ages — this is a standard feature of the trust indenture, designed to accommodate natural seasoning. But watch the gray bars. In the early life of the trust, when delinquency is well below the trigger, extensions run at 10-15 per month. Then, as the blue line approaches the red dashed line in late 2024, extensions spike — 100, 150, 200+ per month. The gap between reported delinquency and adjusted delinquency widens in lockstep.
The result: reported delinquency stays just below the trigger threshold. Adjusted delinquency — which counts the same borrowers plus the ones whose clocks were reset by extensions — sails past it.
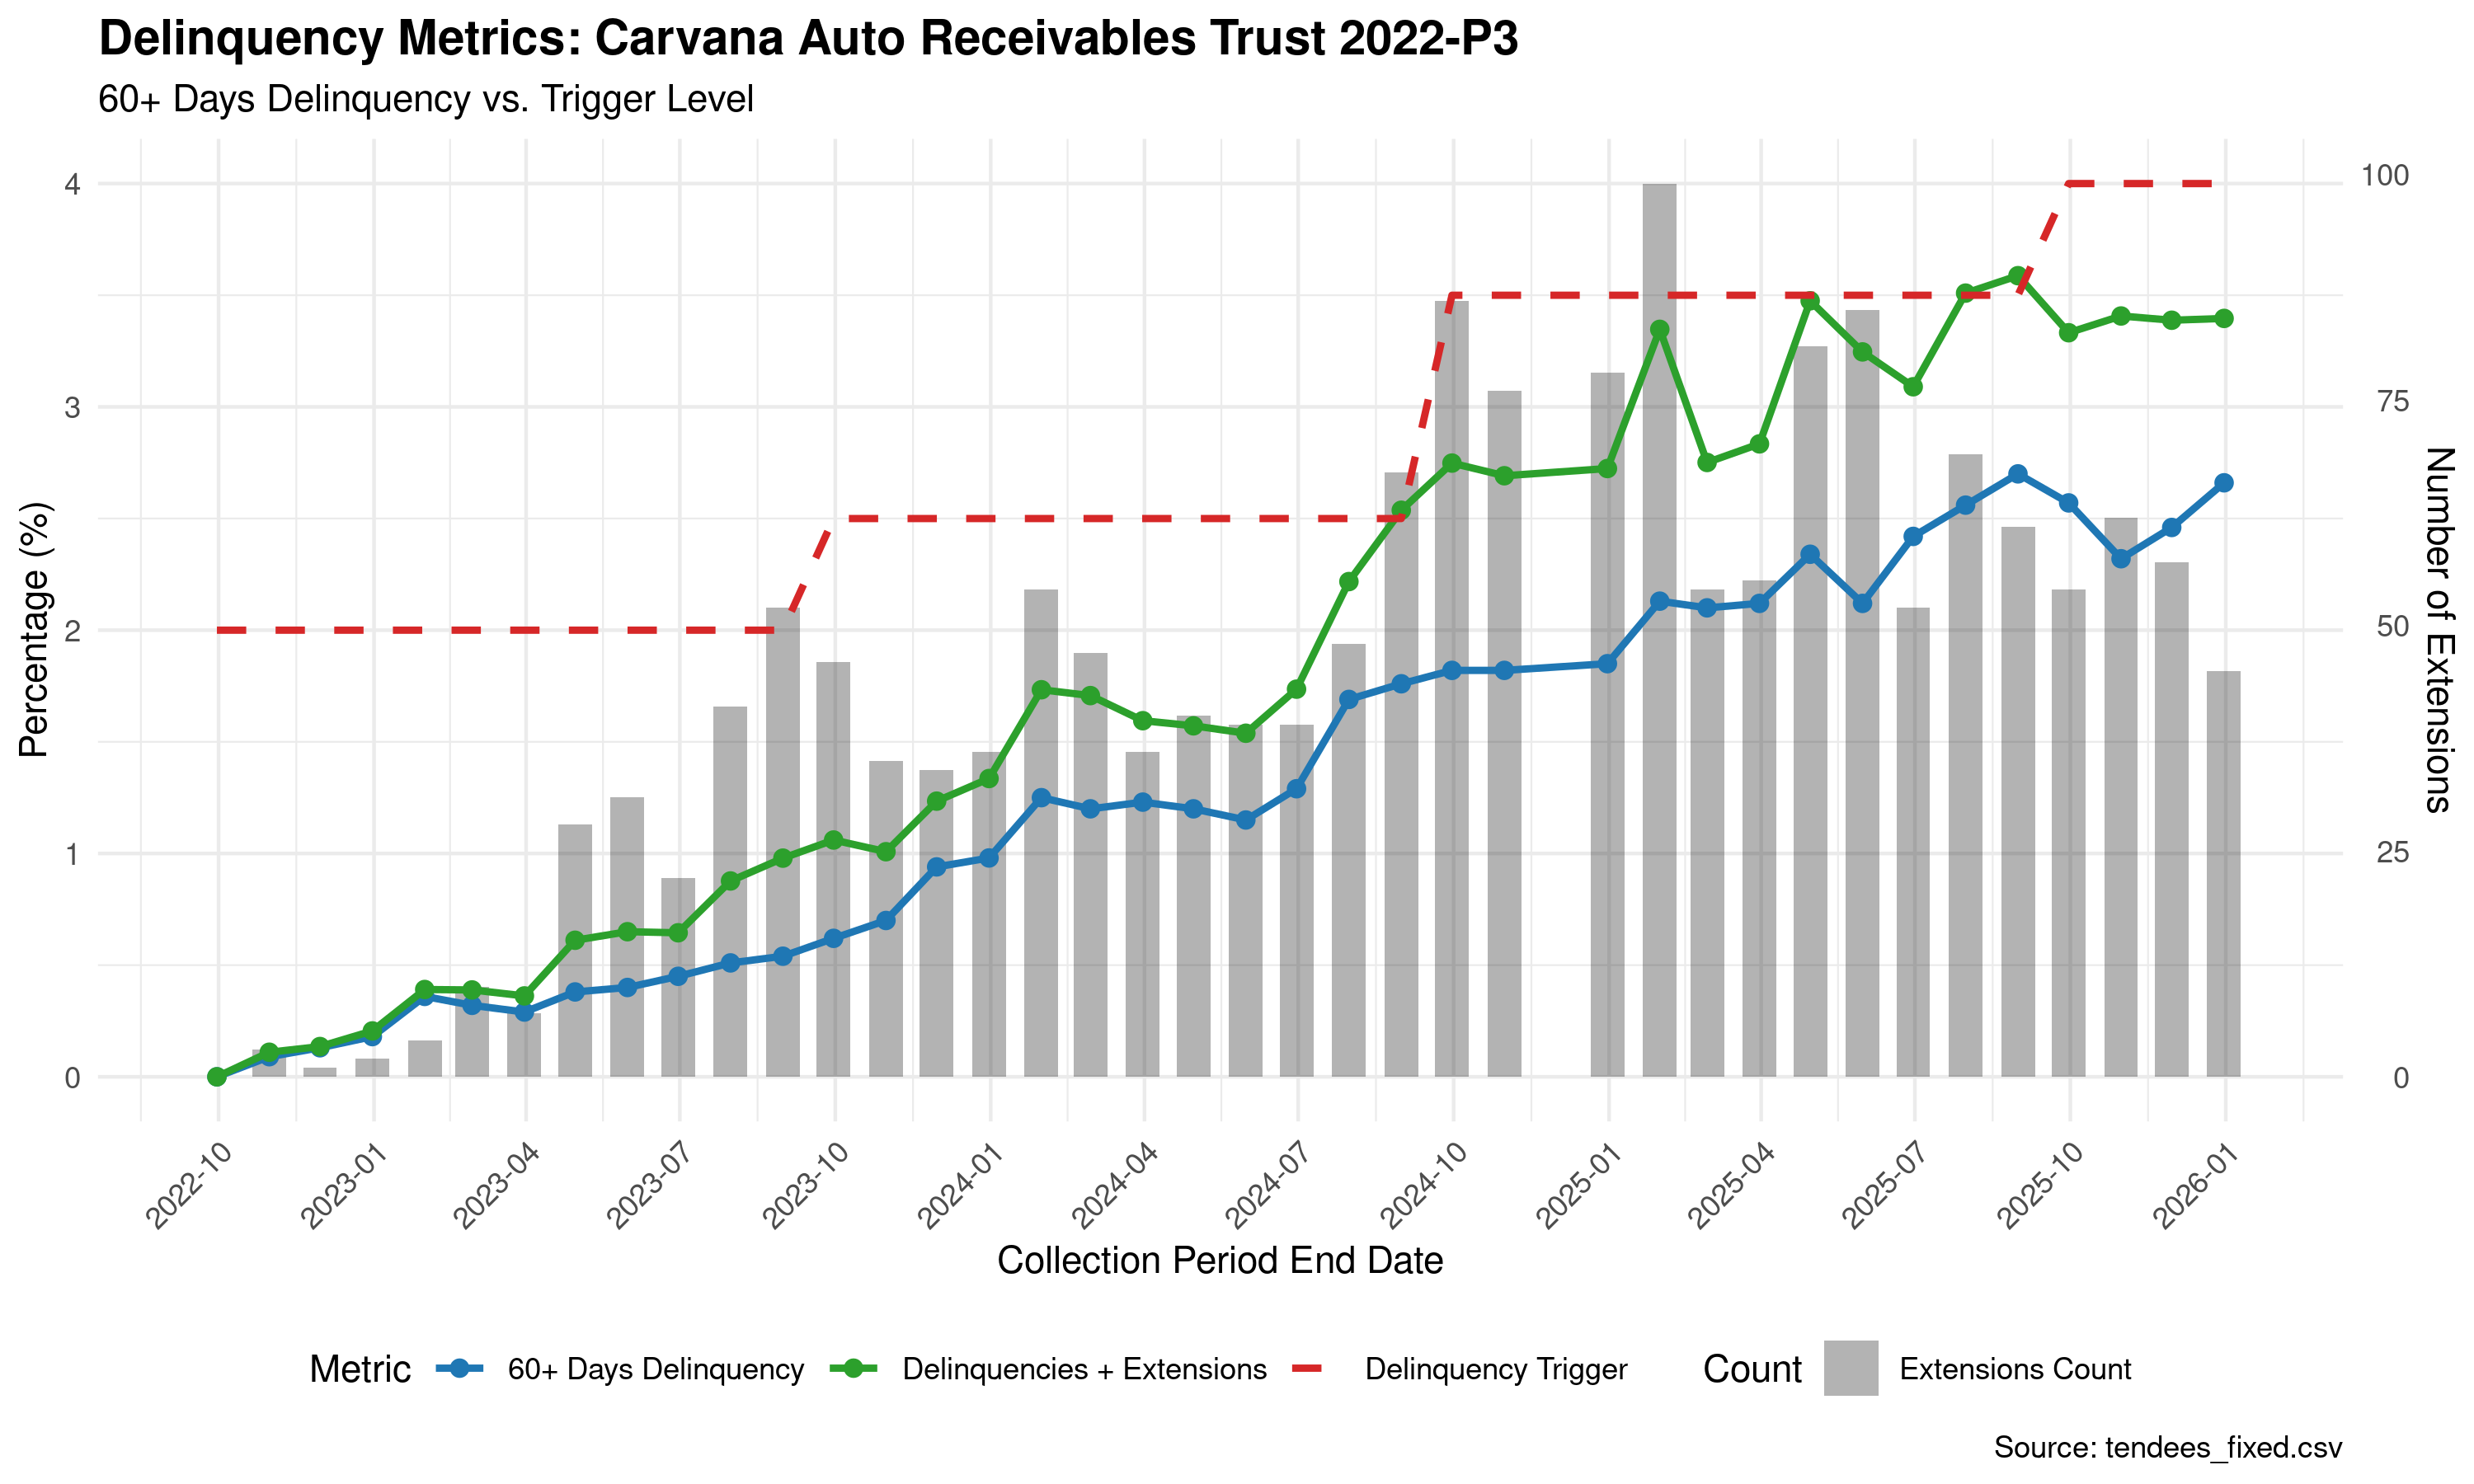
2022-P3 trust. Same dynamics: extensions spike from single digits to 80-100/month as delinquency approaches the trigger. The trigger steps from 2.0% to 2.5% to 3.5%. Reported delinquency stays below 3.5% while adjusted delinquency exceeds it.
The 2022-P3 trust shows the same structure at a slightly smaller scale. Extensions run in the single digits when delinquency is low. They spike to 80-100 per month precisely as the blue line approaches the red dashed line. The gap opens. Reported delinquency stays below the trigger. Adjusted delinquency crosses it.
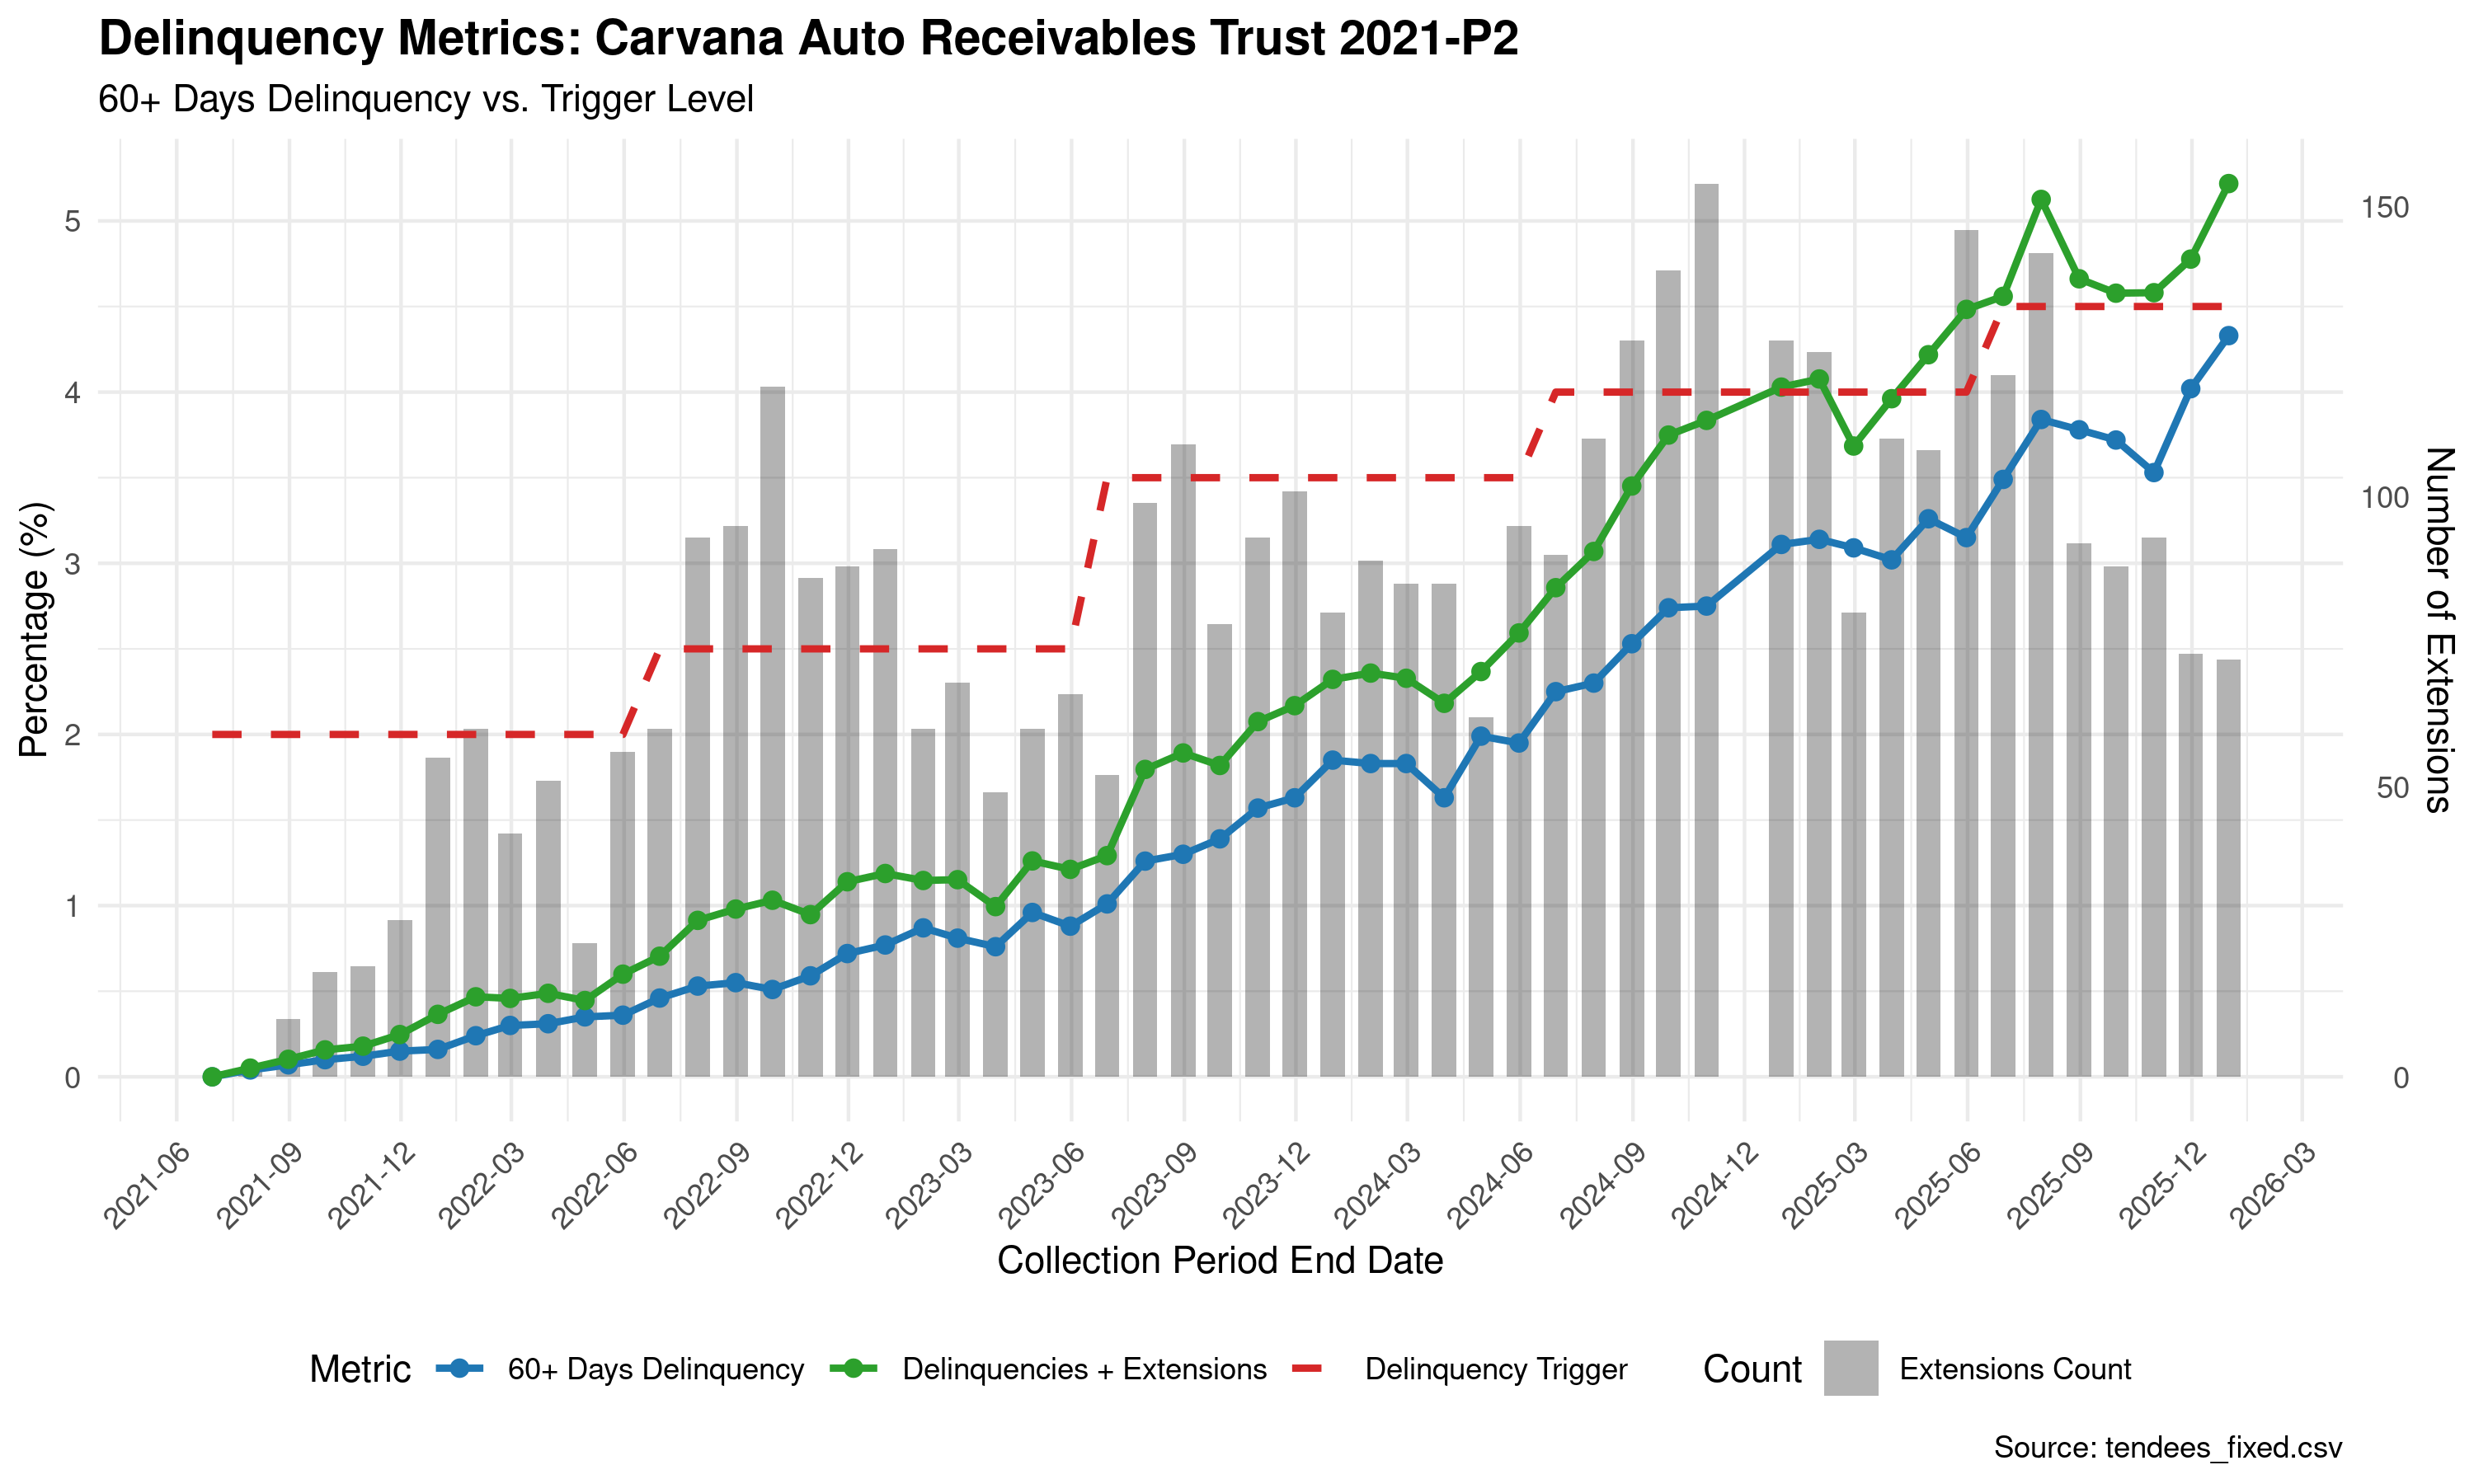
2021-P2 trust — originated during Carvana’s strongest underwriting period. Average FICO 705, average LTV 90%. Even here, extensions spike to 120-150/month as the pool reaches full seasoning and delinquency climbs toward 5%. The trigger threshold steps from 2.0% to 3.5% to 4.5%.
The 2021-P2 chart is particularly notable. These loans were originated in 2021, when Carvana’s underwriting was at its strongest — the “golden age” described in Section II. If any vintage should be able to absorb losses without heavy extension activity, it’s this one. Yet even here, as the pool reaches its fourth year and delinquency rises naturally with seasoning, extensions surge in the same pattern: low when delinquency is low, spiking when it approaches the trigger.
This is what moves the pattern from anecdote to something worth examining closely. One vintage could be coincidence. The same pattern across multiple vintages with fundamentally different credit profiles — including the best-quality pools Carvana ever originated — suggests something more systematic.
IV. THE ALTERNATIVE DATA CONVERGENCE
Everything we’ve shown so far comes from SEC filings — loan-level tapes, servicer reports, and trust indentures. That evidence is damning on its own. But forensic accounting always invites the same question: are you sure the real world matches the data?
It does. And we can show it with statistical rigor.
The Skeptic’s Objection
Before we present the evidence, let’s address the obvious pushback: YouTube isn’t a data source. Dealer sentiment is anecdotal. Creators have incentives to be dramatic for clicks.
This objection is correct — for stocks and housing. “Stock market crash” is a YouTube genre. People watch those videos for entertainment regardless of whether a crash is happening. But used car auction videos are not entertainment. Nobody subscribes to a channel called “Flying Wheels” or “The Real Car Dealer” for apocalyptic content in normal times. The audience for these channels is the industry — small dealers, flippers, wholesale buyers — and they’re watching because they’re experiencing something in their daily business that they need to understand. The fact that this boring, niche topic is generating content volume at all is the anomaly. Attention, in this market, is signal.
Google Trends: The Consumer Side
Google Trends captures something no other data source can: organic consumer attention. People typing queries into a search bar aren’t responding to creator incentives or media narratives. They’re telling you what they’re experiencing. Three signals stand out.
First, “car repossessed” is rising — and it’s statistically significant. A linear regression on weekly search interest shows a slope of +0.14 index points per week — roughly +7.3 points per year — with an R² of 0.73 and a p-value below 0.001. For noisy weekly search data, an R² of 0.73 is remarkably strong. This isn’t a spike or a seasonal blip. It’s a steady, years-long upward trend: more and more people are searching for information about vehicle repossession, week after week.
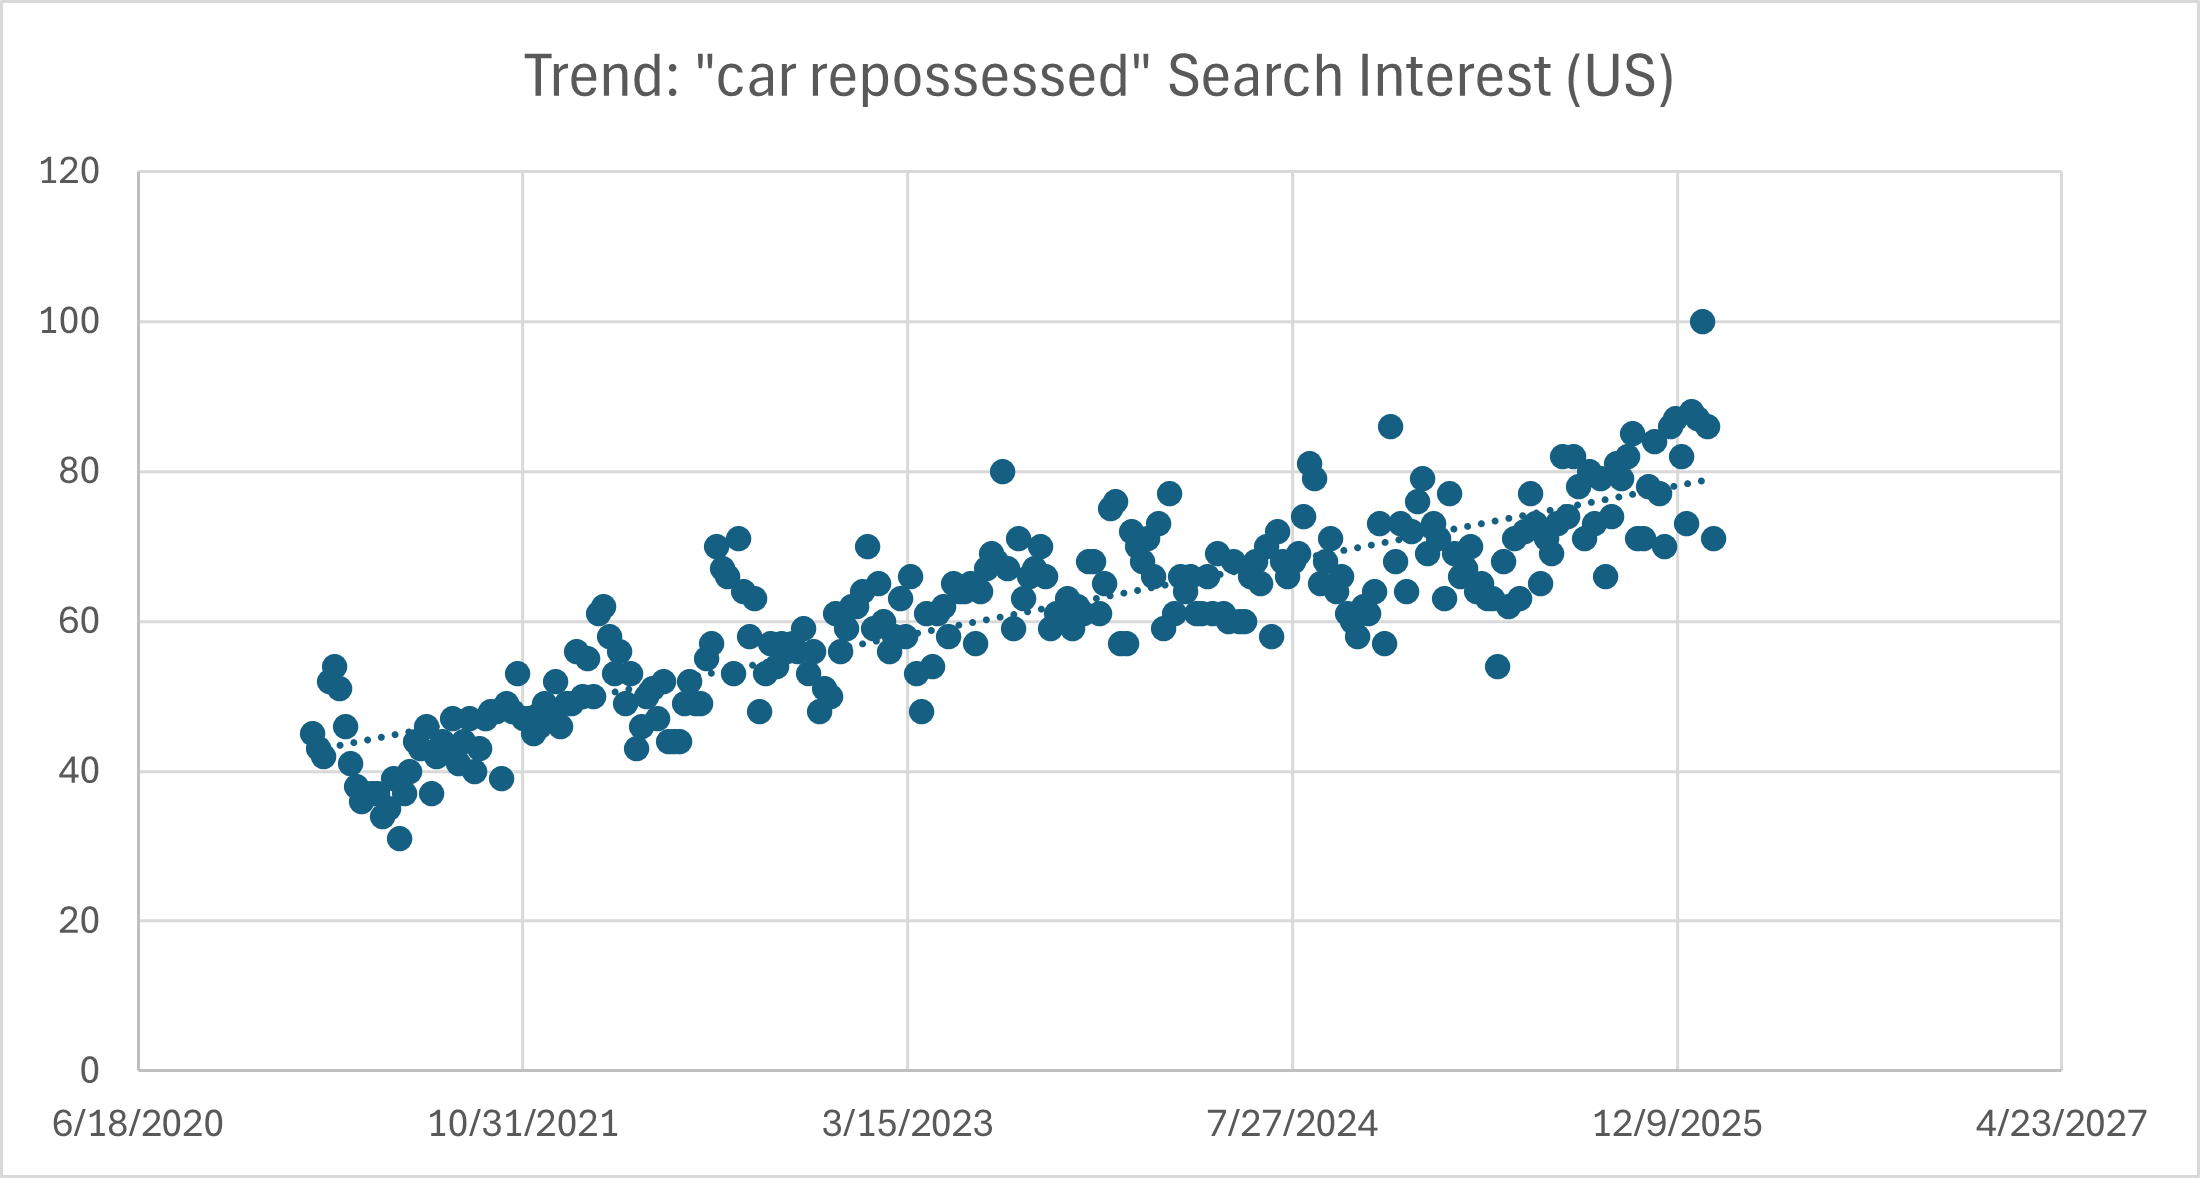
Weekly Google Trends search interest for “car repossessed” (US, 5-year window) with linear trend line. Slope: +0.14 points/week, R² = 0.73, p < 0.001.
The rising queries associated with this search tell the human story behind the trend — “car repossession loopholes” has hit breakout status (>5,000% growth), “how to park your car to avoid repo” is up 1,200%, and “how many days late can you be on a car payment before repo” is up 1,850%. These are not idle curiosity searches. These are people in financial distress trying to keep their vehicles.
Second, “used car market” is spiking. The chart below overlays both terms. Notice that “used car market” search interest was essentially dormant through most of 2024 — nobody was thinking about it because nothing unusual was happening. Then it spikes sharply in late November 2025. Google search interest for a boring topic like the used car market only moves when something out of the ordinary is underway.
Third, Carvana is prominently featured in the rising related searches. As of February 4, 2026, only three company names appear among the rising queries for “car repossessed”: Carvana (+300%), Global Lending Services (+350%), and Exeter Finance (+140%). The other two are subprime auto lenders. Carvana — which markets itself as prime — is keeping company with the subprime names in repossession-related searches.
Something unusual is happening in the used car market, and Carvana appears to be at the center of it. Google Trends can tell us that something is wrong, but it can’t tell us whether the stress is real or just perception. For that, we need to hear from the people actually buying and selling cars.
YouTube Sentiment: Building a Signal from Noise
To move from anecdote to evidence, we built a systematic pipeline. We identified 14 YouTube channels across three categories — independent dealers, market commentators, and wholesale/auction specialists — and collected transcripts from 309 videos published between November 5, 2025 and February 3, 2026, a 90-day window.
Each transcript was analyzed by Claude Sonnet 4 using a prompt designed to separate market conditions from creator mood. This distinction is critical. A dealer complaining about thin margins is telling you margins are compressed — a bearish market signal. A flipper excited about “deals everywhere” is telling you inventory is high and prices are soft — also bearish. The LLM was instructed to ignore emotional spin and extract the underlying market reality across three categorical signals (inventory direction, demand strength, repossession activity), two continuous scores (bullish 0-100, bearish 0-100), and a sensationalism rating (1-10) that we use for quality control.
The statistical analysis was performed in R at the 95% confidence level using weighted binomial tests, paired t-tests, and convergence modeling.
The Results
The signals are unambiguous.
- Of the
140videos that discussed inventory direction,93.5%described increasing inventory (p <0.001, 95% CI:87.8%-96.8%). - Of the
153videos that discussed demand,92.9%described weakening demand (p <0.001, 95% CI:86.4%-95.7%). - Every single video that discussed repossession activity — all
30of them — described it as elevated or surging (p <0.001).
On the continuous sentiment scores, weighted bearish sentiment averaged 71.4 versus bullish at 23.4, a spread of 48 points (paired t-test: t = 12.02, p < 0.001).
The Convergence Check
Raw results aren’t enough. If bearish sentiment is just clickbait creators being dramatic, the signal is noise. So we split the dataset by the LLM’s sensationalism score — a 1-10 rating of how apocalyptic the creator’s tone is, regardless of whether their claims are accurate.
The split was revealing. 175 videos scored as “measured” (sensationalism ≤ 3) and 61 scored as “sensational” (sensationalism ≥ 6), with the remaining 73 in the middle range excluded from the comparison. The measured, data-driven creators — the ones citing specific auction prices and inventory counts in calm tones — were net bearish by +10.2 points. The sensational creators were net bearish by +58.6 points. The magnitude differs. The direction is identical.
Both groups confirm inventory is increasing (measured: 87%, sensational: 100%, both p < 0.001). Both confirm demand is weakening (measured: 84%, sensational: 100%, both p < 0.001). The correlation between sensationalism and bearish score is r = 0.49 — moderate, meaning dramatic creators do tend to score more bearish, but the effect is nowhere near strong enough to explain the entire signal. Strip away every sensational video and the measured creators alone still paint a bearish picture at high statistical significance.
Convergence verdict: HIGH CONFIDENCE. The bearish signal is real, not manufactured by clickbait. Multiple independent creator types, with fundamentally different incentive structures, are all describing the same market conditions.
A Note on Manheim
The attentive reader will notice an apparent contradiction: if the used car market is this stressed, why is the Manheim Used Vehicle Index sitting at 205.5, essentially flat for 18 months?10 The answer is that Manheim measures wholesale auction prices — what dealers pay at auction — not retail market health. The stress we’re documenting is inventory building on dealer lots, demand weakening at the consumer level, and repossessions surging. None of that shows up in Manheim until dealers are forced to liquidate, which hasn’t happened yet. More importantly, this is not a “used car market is crashing” thesis. The broader market is fine. The stress is concentrated in one lender’s specific borrower segment: high-LTV, stated-income, deep-subprime borrowers that no one else wanted. Manheim is a market-wide index — it wouldn’t reflect that stress even if it were fully materialized. And that’s actually the worst outcome for Carvana: when losses hit, they won’t be able to blame macro conditions. Other prime auto lenders will be performing normally. The losses will be obviously, undeniably theirs.
The Three-Source Convergence
Step back and consider what we have. Three independent data sources — none of which reference the others, none of which share a methodology, none of which have overlapping incentive structures — all pointing in the same direction, on the same timeline:
- Google Trends (consumer searches): “car repossessed” trending at 5-year highs with a statistically significant upward slope, and “used car market” spiking sharply in late 2025.
- YouTube dealer sentiment (industry practitioners):
93%+ bearish on inventory and demand at p <0.001, validated by convergence analysis. - Carvana ABS data (SEC filings): credit deterioration across every metric we’ve examined — FICO composition, spreads, LTV, underwater originations, extension patterns.
This is not a coincidence. When the people buying cars, the people selling cars, and the loan-level data from the largest online dealer in America all tell the same story, the story is real.
V. THE BUSINESS MODEL FRAGILITY
Everything we’ve documented so far — the stated income, the FICO engineering, the structurally underwater collateral, the extension patterns, the converging alternative data — amounts to a detailed portrait of a lender whose credit quality has never matched its “prime” label. But “bad loans” alone don’t kill a company. Plenty of lenders survive credit cycles with bruises but intact business models. The reason this matters for Carvana specifically, the reason it’s existential rather than merely embarrassing, is that Carvana’s entire business model is a machine that runs on one fuel: the ability to sell loans to investors. If investors stop buying, the machine doesn’t slow down. It stops.
The Securitization Flywheel
To understand why, you need to understand what Carvana actually is. The popular narrative describes it as an online used car dealer — a tech-enabled alternative to the traditional lot. That framing is correct but incomplete. Carvana is, at its core, a loan originator that uses car sales as the mechanism for generating those loans. The cars are the product. The loans are the business.
Here’s how it works. Every quarter, Carvana originates hundreds of millions of dollars in auto loans. It pools those loans into a legal entity called a trust — the Carvana Auto Receivables Trusts we’ve been analyzing throughout this report. The trust then issues Asset-Backed Securities in layers, called tranches: senior notes (rated AAA, sold to conservative investors like pension funds and insurance companies) and junior or subordinated notes (rated lower, sold to investors willing to take more risk for higher yield). Carvana sells these securities to investors, receives cash, and uses that cash to fund the next round of loan originations. Then it repeats the process, every quarter, indefinitely.
This is the securitization flywheel, and it is not optional. Carvana does not hold these loans on its balance sheet. It cannot afford to — the company’s balance sheet doesn’t have the capacity to warehouse billions in auto loans while waiting for borrowers to repay them over five to seven years. The securitization market is Carvana’s oxygen supply. Roughly half of the company’s gross profit comes from securitization gains — the spread between the interest rate on the loans and the price at which the ABS are sold to investors. Without this flywheel, Carvana cannot originate new loans, cannot sell cars on credit, and cannot generate the revenue that Wall Street is pricing into a $415 stock.
The Repricing Cascade
Now connect this back to Pillars I through IV.
ABS investors are not buying these securities blindly. They receive monthly servicer reports — the same reports we’ve been analyzing — that show exactly how each trust is performing: delinquency rates, loss rates, extension activity, prepayment speeds. Right now, the 2024 and 2025 vintages are only 8-12 months old. Auto loan losses typically peak at 18-24 months post-origination.11 The worst is ahead, not behind.
As losses accelerate — and they will, because the underlying collateral is materially worse than what investors were told to expect from a “prime” issuer — a repricing cascade begins:
Stage 1: Investor scrutiny. Institutional ABS investors start comparing Carvana’s pool performance against other prime auto issuers. The gap will be impossible to ignore. The 100% stated income, the sub-550 FICO cohort, the 39% underwater originations, the extension spikes near triggers — all of this is visible in the public filings if anyone bothers to look. Some already are.
Stage 2: Spread widening. Investors demand higher yields to compensate for the risk. Junior tranche spreads, which currently sit in the range that reflects prime auto lending, widen toward levels associated with subprime issuers. Every basis point of spread widening means Carvana receives less cash when it sells the ABS, which means less capital to recycle into new loans.
Stage 3: Tranche failure. If losses exceed expectations badly enough, investors may refuse to buy the junior tranches at any price. This is the critical threshold. A securitization cannot close without buyers for every tranche. If the junior notes don’t sell, Carvana has two options: hold them on its own balance sheet (concentrating the very risk it was trying to offload) or fail to complete the securitization entirely. Either option is devastating.
Stage 4: Flywheel seizure. If Carvana cannot securitize, it cannot originate. If it cannot originate, it cannot sell cars on credit. If it cannot sell cars on credit, revenue collapses. The 10,000% rally unwinds.
This isn’t a hypothetical sequence. It’s the exact chain of events that has played out in every securitization-dependent lender that experienced a credit deterioration cycle. The only question is timing.
The Debt Maturity Wall
Layered on top of the securitization risk is a more conventional problem: Carvana carries approximately $5.6 billion in total debt. The 2023 restructuring — which swapped unsecured notes for new senior secured tranches due in 2028, 2030, and 2031 — eliminated near-term maturities but did so under terms that reflected desperation: 9-14% interest rates, PIK (pay-in-kind) options that let the company defer cash interest by issuing additional debt, and restrictive covenants that give creditors significant leverage. The PIK period is ending, meaning full cash interest payments are resuming just as credit quality is deteriorating.
Refinancing this debt requires access to capital markets. Access to capital markets requires investor confidence. Investor confidence requires a functioning securitization program and a credible credit story. If the repricing cascade described above is underway when the 2028 maturity arrives, Carvana will be trying to refinance billions in debt at the worst possible moment — with ABS investors fleeing, equity value collapsing, and credit markets demanding prohibitive rates.
The 2023 restructuring bought time. It did not solve the underlying problem. And the clock is ticking.
The Historical Parallel
None of this is unprecedented. The auto lending industry has seen this exact pattern before, and the outcomes were predictable.
Between 2015 and 2017, Santander Consumer USA ran an aggressive subprime auto lending operation. High origination volumes, strong securitization gains, a rising stock price. Then losses began exceeding projections. ABS spreads widened. In 2018, the SEC charged Santander with accounting failures related to its credit loss reporting. Then in 2020, 34 state attorneys general reached a $550 million settlement with the company over allegations that Santander had placed borrowers into auto loans it knew carried an unacceptably high probability of default.12 The stock cratered.
Credit Acceptance Corporation followed a similar arc. A pure subprime auto lender, CACC rode the post-crisis credit expansion aggressively, saw its stock climb to nearly $500, and then faced a series of enforcement actions — a Massachusetts AG lawsuit in 2020 that sent shares down over 40% in weeks13, followed by a CFPB lawsuit alleging the company set borrowers up to fail14. The pattern was the same each time: aggressive origination, deteriorating credit, regulatory reckoning, stock collapse.
The parallels to Carvana are obvious. But there is one critical difference: Santander and Credit Acceptance were honest about being subprime. Their investors knew they were buying risk. The securities were priced accordingly, and the subordination levels were set to absorb subprime-level losses.
Carvana markets its ABS as prime. The investors buying these securities expect prime performance — low single-digit cumulative losses, stable delinquency, predictable cash flows. When they discover that the collateral is actually subprime dressed in prime clothing — 100% stated income, 39% underwater, a manufactured FICO distribution, and trigger management through extensions — the repricing won’t be gradual. It will be a step function. And the betrayal of expectations will make the market reaction worse than if Carvana had been honest about its credit quality from the beginning.
VI. THE OPPORTUNITY
This is not a story we’re telling after the fact. The thesis has a catalyst path, a timeline, and defined risks. Here’s how we see it playing out.
The Trade
We are short CVNA at $471, hedged with a $490 call expiring March 20, 2026. The structure caps our maximum loss above $490 while giving us full exposure to the downside. Target: $165-250 over 12-18 months, representing 40-60% downside from current levels (the stock traded at $415 at the time of publication).
This is a high-conviction, high-volatility position. Carvana has meme-stock characteristics and can move violently on earnings surprises or short squeezes. Anyone considering this trade should size it accordingly: 2-5% of portfolio, with defined risk through options structures rather than naked short exposure.
The Catalyst Path
February 18, 2026: Q4 Earnings. Consensus expects $5.25 billion in revenue, implying 48% year-over-year growth. The ABS data tells us how they got the volume to support those numbers: pool sizes grew 79% (from 19,000 to 34,000 loans per pool) by accepting borrowers they never would have touched in 2021. They may hit the revenue number. But if they do, it’s because they wrote loans to anyone who applied — and the credit quality of those loans is already visible in the data we’ve presented. Earnings can be managed. What matters more is what comes next.
March 2026: 2026-P1 ABS Issuance. This is the next loan tape. If it shows continued deterioration — larger sub-550 FICO cohorts, higher LTV ratios, wider spreads on high-FICO borrowers — it validates that the trends documented in this report are accelerating, not stabilizing. The first monthly servicer reports for this vintage, plus updated reports for the 2024-2025 pools, will follow in mid-March.
Q2-Q3 2026: Peak Loss Period. Auto loan losses typically peak at 18-24 months post-origination. The 2024 vintages — originated at the peak of the high-spread strategy, when FICO explained barely a quarter of pricing variance, with 100% stated income and roughly a third of loans underwater from day one — enter this window starting in April. This is when monthly loss rates should accelerate from current levels toward the numbers that eat through subordination buffers. If losses spike, ABS investors will demand wider spreads on new issuances. Rating agencies may downgrade. Early amortization triggers — the ones we showed being managed through extensions in Pillar 4 — become harder to suppress as cumulative losses mount.
Late 2026: The Reckoning. The 2025 vintages, originated under the loosest standards in company history, approach their own peak loss window. By this point, the credit deterioration should be consensus, not a contrarian view. The question becomes whether Carvana can continue securitizing at all, and whether it can refinance the $1 billion in senior secured notes maturing in 2028 under conditions that don’t amount to a second restructuring.
What Could Prove Us Wrong
Every short thesis has risks. Intellectual honesty requires naming them.
Aggressive Fed rate cuts could bail out underwater borrowers by making refinancing available. But this cuts both ways: if the Fed is cutting aggressively, the economy is weak enough to cause job losses, which drives defaults higher, not lower.
A used car price spike — say 15%+ — would restore collateral value and reduce loss severity on underwater loans. This would require a supply shock on the scale of COVID. The current environment is the opposite: inventory building, demand weakening.
Management could tighten underwriting standards, which would improve future vintages but crater near-term volume and earnings. The stock drops either way — either from credit losses on existing loans or from missed growth targets on new ones.
ABS investors might not care. Maybe losses stay within subordination buffers and the “prime” label proves stickier than we expect. But losses are already visible in monthly servicer reports. Smart money reads these filings. Once cumulative losses on a vintage cross 5%, the narrative breaks.
Timing is the hardest part. Carvana can use accounting to smooth earnings and manage optics longer than fundamentals justify. The market can stay irrational. This is why we have a 12-18 month timeline, not a 3-month one. Eventually losses are cash, not accounting entries. Cash doesn’t lie.
The Bottom Line
This is not a new story. It’s the same playbook that played out with subprime mortgages in 2006-2008 and subprime auto lenders in 2017-2020: aggressive growth funded by securitization, credit quality deteriorating behind managed metrics, losses visible in granular data before consensus catches on, and then a repricing event that collapses the model.
We are in the early innings. The data is public. The pattern is clear. The alternative data confirms it. And the market hasn’t priced any of it in — the stock sits near all-time highs, priced for a growth story, while the loan tapes tell a credit story.
Carvana is a subprime lender calling itself prime. The data proves it. The losses are coming. The market will figure it out.
APPENDIX: METHODOLOGY & DATA SOURCES
ABS Data
- Source: SEC EDGAR — all Carvana Auto Receivables Trust filings (2021-P1 through 2025-P4)
- Loan-level data: Form ABS-EE, Exhibit EX-102 (FICO, LTV, APR, income verification status, loan term)
- Performance data: Monthly servicer reports via Form 10-D (delinquency, losses, extensions, trigger levels)
- Code: Available on GitHub at [link]
YouTube Sentiment Analysis
309videos collected from14channels (Nov 5, 2025 - Feb 3, 2026)- Channels span three categories: independent dealers, market commentary, wholesale/auction
- Transcripts extracted via youtube-transcript-api
- Each transcript analyzed by Claude Sonnet 4 with a structured prompt designed to extract market conditions (not creator mood) across inventory direction, demand strength, repo activity, bullish/bearish scores (0-100), and sensationalism rating (1-10)
- Statistical analysis performed in R: weighted binomial tests, paired t-tests, ANOVA, and convergence model with sensationalism stratification
- Code: Available on GitHub at [link]
Google Trends
- Search terms: “car repossessed,” “used car market”
- Geography: United States
- Timeframe: 5 years (2021-2026)
- Trend analysis: linear regression on weekly “car repossessed” data (slope
+0.14/week, R² =0.73, p <0.001)
Consumer Financial Protection Bureau. (2024, June). “Data Spotlight: Negative Equity Findings from the Auto Finance Data Pilot.” The CFPB found that between 2018 and 2022, 11.6% of all vehicle loans included negative equity at origination, peaking at just over 17% in 2020 and falling to just under 8% in 2022. Consumers who financed negative equity were more than twice as likely to have their account assigned to repossession within two years. ↩︎ ↩︎
Federal Reserve Board. (2024, January 12). “The Effects of Credit Score Migration on Subprime Auto Loan and Credit Card Delinquencies,” FEDS Notes. The Fed defines subprime as Equifax Risk Scores below 620, near-prime as 620-719, and prime as above 720. Deep subprime (below 550) is a widely used industry classification. ↩︎
Consumer Financial Protection Bureau. (2021, September). “Data Point: Subprime Auto Loan Outcomes by Lender Type.” The CFPB found the likelihood of a subprime auto loan becoming 60+ days delinquent within three years ranges from 15% (bank borrowers) to 25-40% (finance company and buy-here-pay-here borrowers). The CFPB’s 2023 lawsuit against Credit Acceptance noted that among borrowers with median FICO scores of 546, a majority became delinquent and the company repossessed over 25% of financed vehicles nationally. ↩︎ ↩︎
U.S. Securities and Exchange Commission, 17 CFR § 229.1125 (Item 1125) — Schedule AL, Asset-level information. Electronic Code of Federal Regulations. ↩︎
Blackburn, M. & Vermilyea, T. (2012). “The Prevalence and Impact of Misstated Incomes on Mortgage Loan Applications,” Journal of Housing Economics, 21(2), 151-168, citing Steven Krystofiak testimony that “60 percent of 100 stated-income loans examined appeared to overstate income by at least 50 percent.” Federal Reserve Bank of San Francisco working paper. ↩︎
Financial Crisis Inquiry Commission. (2011). The Financial Crisis Inquiry Report. Washington, DC: U.S. Government Printing Office. Full report (PDF). See also Black, W. (2011), “Lenders Put the Lies in Liar’s Loans,” noting that mortgage fraud investigators found most stated-income fraud occurred at the suggestion of the loan originator, not the consumer. ↩︎
Standard credit modeling literature expects FICO to explain the majority of pricing variance in prime consumer lending. See Einav, L., Jenkins, M., & Levin, J. (2012). “Contract Pricing in Consumer Credit Markets,” Econometrica, 80(4), 1387-1432. Carvana’s own 2021-2022 vintages demonstrate R² of 0.50-0.60 between FICO and spread, consistent with prime auto lending; the subsequent collapse to 0.25 represents a fundamental breakdown in risk-based pricing. ↩︎
Federal Deposit Insurance Corporation. “The Changing Landscape of Indirect Automobile Lending,” Supervisory Insights. The FDIC documented that institutions with “officers routinely approving credits in excess of 100 percent loan-to-value” were building portfolios of “high loan-to-value, subprime loans” — explicitly characterizing routine above-100% LTV origination as a subprime indicator. ↩︎
DealershipGuy. (2026, January 16). “Nearly 30% of Trade-Ins Are Underwater as Auto Loan Stress Deepens.” 29.3% of trade-ins toward new-vehicle purchases had negative equity in Q4 2025, the highest share since Q1 2021. ↩︎
Cox Automotive. “Manheim Used Vehicle Value Index.” The index measures prices paid for used vehicles sold at Manheim’s U.S. wholesale auctions, not retail market conditions or dealer lot inventory levels. ↩︎
Federal Reserve Board. (2024, September 26). “Rising Auto Loan Delinquencies and High Monthly Payments,” FEDS Notes. The research shows loans originated in 2022 and 2023 have “appreciably steeper increases in delinquencies” with the steepest vintage curves appearing in months 12-24. ↩︎
New York Attorney General. (2020, May 19). “Attorney General James Announces Over $550 Million Settlement with Nation’s Largest Subprime Auto Financing Company.” The 34-state settlement resolved allegations that Santander Consumer USA “violated consumer protection laws by exposing consumers to unnecessarily high levels of risk and knowingly placing these consumers into auto loans that had a high probability of default.” See also California AG announcement. ↩︎
Massachusetts Attorney General. (2020, August 31). “AG Healey Sues Major Subprime Auto Lender for Unfair and Deceptive Practices.” The subsequent September 2021 settlement of $27 million resolved allegations that Credit Acceptance made loans “it knew or should have known many borrowers would be unable to repay.” ↩︎
Consumer Financial Protection Bureau. (2023, January 4). “CFPB and New York Attorney General Sue Credit Acceptance for Hiding Auto Loan Costs, Setting Borrowers Up to Fail.” The lawsuit alleged Credit Acceptance “predicted that it would not be able to collect the full amount financed” on nearly 40% of loans but extended them anyway. ↩︎