CoreWeave: Caught Between Paper and Silicon
CoreWeave’s Race Against Physical Reality
I. EXECUTIVE SUMMARY
The AI infrastructure buildout is the largest capital expenditure cycle in human history. Hundreds of billions of dollars are flowing through a supply chain that converts financial commitments — contracts, leases, debt — into physical infrastructure: GPUs racked in data centers, running workloads, generating revenue. The conversion works as long as every link in the chain keeps pace. If any link slows down, the financial obligations don’t pause. They compound.
This report maps that chain, identifies where the stress concentrates, and explains why CoreWeave — a GPU cloud provider that went public in March 2025 — is the most transparent and most fragile link to monitor. We are short CRWV via a September 2026 bear put spread, targeting $45-80 against a current price of approximately $90.
CoreWeave is not the villain in this story. It is the victim. The company is doing exactly what the market is asking it to do: borrow money, buy GPUs, deploy them, and sell compute to the hyperscalers building the AI future. The problem is not the strategy. The problem is the physics of the conversion — the irreducible time between when a financial commitment is made and when a GPU starts earning revenue. Every day in that gap costs money. And the gap is growing.
Three independent financial indicators confirm the stress is real, not a story we’re imposing on the data:
- Days Sales Outstanding hit
182days in Q4 20251 — customers owe CoreWeave more than two full quarters of revenue. - Capital expenditure efficiency is declining: each dollar of capex produced
$0.31of incremental revenue in FY2025 and is guided to produce just$0.25in FY2026. - Construction in progress — hardware purchased but not yet generating revenue — reached
$9.4billion, accruing interest and depreciation against zero income.
Interest coverage is guided to compress to roughly 1.5x in Q1 2026 — a level where a single quarter of execution miss could push coverage below 1x.
The financial strain is compounding against a structural headwind. The AI compute market is shifting from training-dominated workloads — which require massive, rigid GPU clusters — to inference-dominated workloads, where quantization, distillation, and purpose-built hardware are compressing cost per token at roughly 10x per year. CoreWeave’s $30B+ FY2026 capex plan buys general-purpose NVIDIA GPUs into a market where the dominant use case is migrating toward hardware and pricing models that CoreWeave does not control. The hyperscalers — CoreWeave’s customers — are building their own inference silicon.
The catalyst is straightforward. CoreWeave guided FY2026 revenue of $12-13B against a Q1 guide of just $1.95B. That implies Q2-Q4 must average $3.5B per quarter — more than double any quarter the company has ever reported. Q2 2026 earnings, expected in August, will be the inflection point: either the hockey stick materializes, or the market reprices the gap between demand and deliverability. The market may already be signaling skepticism: CoreWeave has sold off after all three earnings reports as a public company, with Q4 EPS missing consensus by 130%.
This is not a bet against AI. It is a bet that the financial scaffolding above the physical buildout has gotten ahead of the conversion speed — and that CoreWeave, sitting at the most leveraged point in the chain, will be the first place it shows.
II. THE CHAIN
Every dollar of AI compute travels through a supply chain with measurable financial touchpoints. Understanding the chain is the prerequisite for understanding where it can break.
At the top, Microsoft signs contracts with enterprise customers and commits to GPU capacity through finance leases — obligations that have grown from $22.9B in Q1 2024 to $60.2B by Q4 2025.2 Below that, Microsoft’s Remaining Performance Obligations — the total value of contracted but undelivered cloud services — reached $631B in Q4 2025, up from $242B just seven quarters earlier. That is $389B in new contractual commitments in under two years.
CoreWeave sits in the middle. It borrows money — $21.4B in total debt as of Q4 2025 — buys GPUs from NVIDIA, racks them in data centers, and sells the compute back to hyperscalers like Microsoft under long-term contracts. Its revenue backlog hit $66.8B by Q4 2025, up from $14.7B at its IPO nine months earlier.1 Microsoft alone accounts for roughly 67% of CoreWeave’s revenue.
Below CoreWeave, NVIDIA ships the GPUs — $215.9B in FY2026 revenue, roughly 90% from data center.3 Below NVIDIA sits TSMC, the foundry that fabricates the silicon. NVIDIA’s purchase obligations — wafers ordered from TSMC and other suppliers — totaled $45.8B as of Q2 FY2026.4
Paper vs. Silicon
The chain has a dividing line, and it runs through NVIDIA’s revenue recognition. Everything above it is a financial claim on future GPUs. Everything below it is the physical supply chain that creates them. NVIDIA’s data center revenue is the moment paper becomes silicon — the point at which a chip is shipped, received, and begins its economic life.
| Layer | What It Represents | Amount |
|---|---|---|
MSFT RPO ($631B) | Contracts with cloud customers | Paper |
MSFT Finance Leases ($60B) | Commitments to GPU capacity providers | Paper |
CRWV Revenue Backlog ($66.8B) | Contracted future compute delivery | Paper |
CRWV Total Debt ($21.4B) | Borrowed money to buy GPUs | Paper |
NVDA Quarterly Revenue ($68.1B, ~90% Data Center) | GPUs actually shipped | Silicon |
NVDA Inventory ($19.8B) | GPUs being assembled | Transitioning |
NVDA Purchase Obligations ($45.8B) | Wafers ordered from TSMC | Paper |
When analysts cite $300B+ in AI datacenter capex “committed,” they are measuring the paper above the line. The silicon below it accumulates more slowly. NVIDIA’s cumulative data center revenue since mid-2023 — the total value of GPUs that have actually been shipped and plugged in — is approximately $350B.3 Hyperscaler capex commitments over the same period exceed $700B. The difference is in the pipeline: land acquisition, power procurement, construction, networking, cooling — or still sitting as undrawn financial commitments waiting for physical infrastructure to be ready.
An accounting distinction matters here: revenue is recognized when the service is actually delivered — when a GPU is racked, powered, and running a customer’s workload. Not when a contract is signed. Not when hardware is ordered. CoreWeave’s $66.8B backlog is not revenue. It is a promise to deliver compute that has not yet been delivered. Every dollar of that backlog must pass through the physical conversion pipeline — shipping, construction, power connection, testing, customer onboarding — before it counts.
The gap between paper and silicon is not a problem in itself. Capital projects always lead physical deployment. The question is whether the financial obligations stacking up in the gap can be serviced while the physical buildout catches up. For most of the chain, the answer is yes — Microsoft and NVIDIA have the balance sheets and cash flows to absorb delays. But there is one link where the gap creates acute, measurable stress.
III. COREWEAVE: THE LEVERAGED TIME ARBITRAGE
CoreWeave’s business model is a time arbitrage: borrow money → buy GPUs → deploy them → generate revenue before interest eats you alive. The company is essentially a leveraged GPU REIT — it buys depreciating assets with borrowed money and rents them out, betting that utilization rates and contract terms will generate enough cash flow to service the debt and eventually produce a return.
The model has a brutal corollary. Every dollar CoreWeave spends on GPUs starts accruing two costs the moment it leaves the building:
- Interest on the debt that funded the purchase
- Depreciation on the asset itself
Revenue from that GPU starts only when it is racked, powered, connected, and contracted. The time between purchase and revenue is the gap that defines whether the model works. And the cost of that gap is calculable:
| Component | Annual Rate per $1B in Assets | Daily Cost per $1B |
|---|---|---|
| Interest (~8% blended, declining) | $80M | $219K |
| Depreciation (5-yr straight-line) | $200M | $548K |
| Facilities & power (est.) | $10M | $27K |
| Total carrying cost | $290M | $795K/day |
The Scale of the Bet
The numbers are staggering for a company that went public less than a year ago:
| Metric | Value |
|---|---|
| FY2025 Revenue | ~$5.1B |
| FY2025 Capex | $14.9B |
| FY2026 Guided Revenue | $12-13B |
| FY2026 Guided Capex | $30B+ (“at least”) |
| Total Debt (Q4 2025) | $21.4B |
| Revenue Backlog | $66.8B |
| Customer Concentration (MSFT) | ~67% |
| Net Working Capital | -$8.95B |
| Debt-to-Equity | 6.4x |
The revenue backlog is real. The demand is real. CoreWeave is not fabricating contracts. But demand and cash are not the same thing. A $66.8B backlog means nothing if the company cannot convert it into revenue fast enough to stay ahead of the interest payments on $21.4B in debt, the depreciation on a fleet of GPUs losing a fifth of their value every year, and the carrying costs on billions in hardware that has been purchased but not yet deployed. With $14.9B in FY2025 capex behind them and $30B+ guided for FY2026, every week of deployment delay across the portfolio costs tens of millions of dollars.
The Q1 2026 Margin Trough
This is not an abstract risk. CoreWeave’s Q1 2026 guidance tells you exactly how the time arbitrage works — and how it hurts. Management guided adjusted operating income of just $0-40M on $1.9-2.0B in revenue. That is an operating margin of 0-2% on a business that posted $88M in adjusted operating income in Q4 2025.
Why so thin? Because the massive $8.2B in Q4 2025 capex generates depreciation and interest expense immediately upon purchase. The revenue from deploying that capacity ramps over subsequent months as data centers come online and workloads are contracted. The financial clock starts ticking before the GPU starts earning.
This is the core dynamic of the entire thesis. CoreWeave is not losing money because demand is weak. It is losing money because the physical conversion — buying GPUs, building data centers, connecting power, racking hardware, testing systems, onboarding customers — takes time. And time, at $795K per day per billion dollars in assets, is expensive.
IV. CONSTRUCTION IN PROGRESS: THE CANARY IN THE BALANCE SHEET
If you read one line item in CoreWeave’s financial statements, make it this one.
Construction in Progress (CIP) represents infrastructure that has been purchased or is being built but is not yet in service. It does not generate revenue. It does not get depreciated (because it is not yet a productive asset). But the debt that funded it accrues interest every day. CIP is the financial embodiment of the conversion gap — the pile of silicon and steel waiting to become a revenue-generating data center.
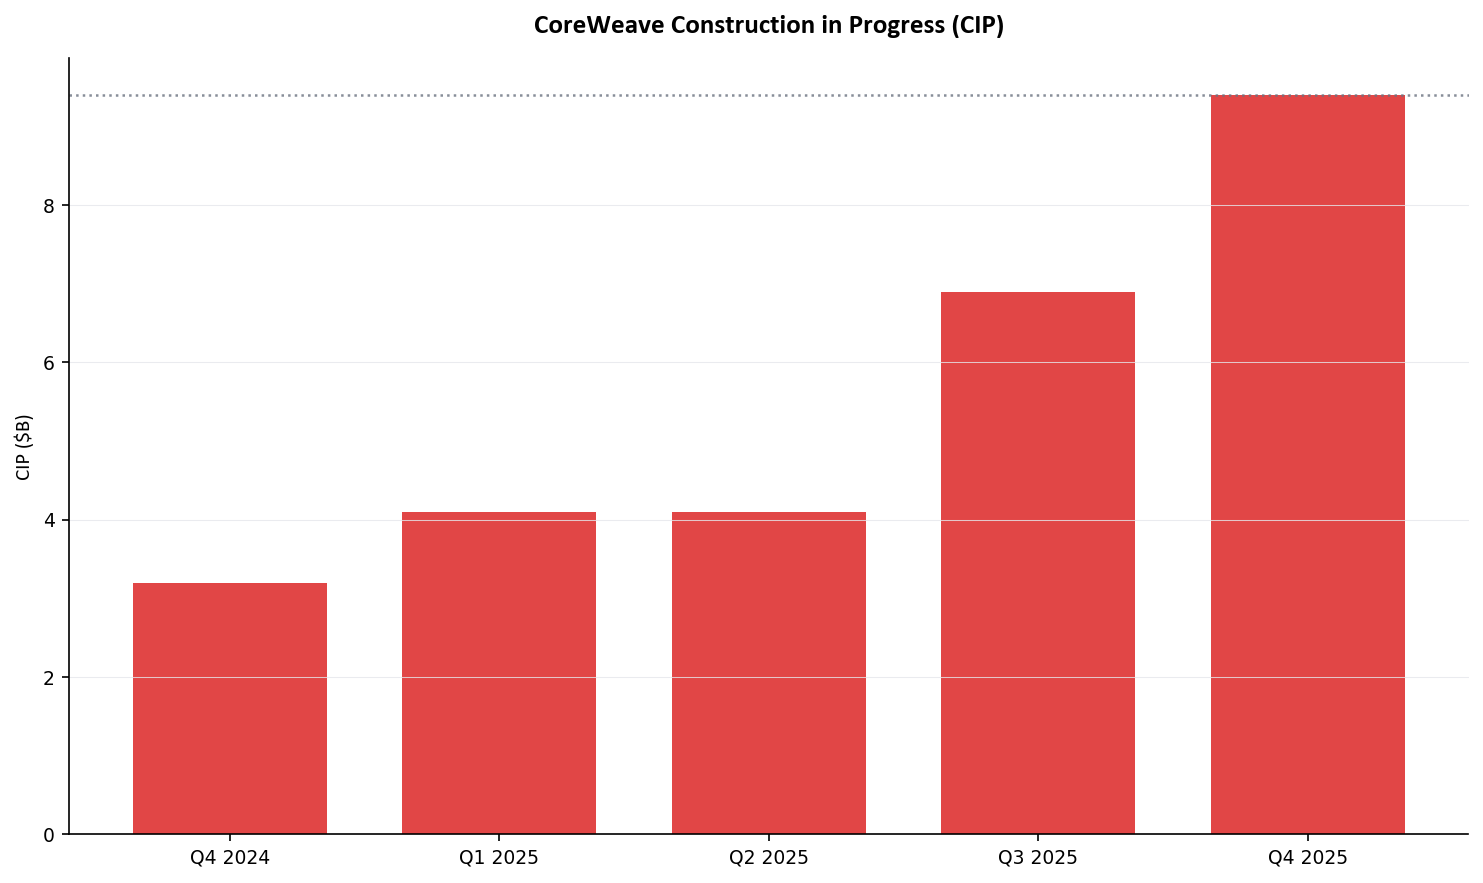
Q4 2025: CIP = $9.4B — up +36% from ~$6.9B at Q3 2025 and +194% YoY from $3.2B at Q4 2024.
That $9.4B represents GPUs ordered from NVIDIA but not yet racked, data centers under construction, hardware in transit, and equipment delivered but awaiting power and cooling connections. At CoreWeave’s blended interest rate, the carrying cost on $9.4B in idle assets is roughly $750M per year — $2M per day — against zero revenue.
A related metric from CoreWeave’s cash flow supplemental disclosure reinforces the picture: Capital Expenditures Incurred but Not Yet Paid — the value of hardware orders placed on credit but not yet settled in cash — stood at $2.66B on a nine-month cumulative basis through Q3 2025.1
Together, these two numbers tell you how fast the pipeline is flowing. CIP measures how much hardware is waiting to be deployed. Capex incurred but not yet paid measures how much hardware has been ordered but not yet settled financially. If both rise faster than revenue and deployed megawatts, the system is backing up — the conversion gap is widening, and the carrying costs are compounding.
V. CASH COLLECTION IS BROKEN
The conversion gap does not end when a GPU is deployed. It extends through the revenue cycle itself. CoreWeave is recognizing revenue — recording sales on its income statement — far faster than it is collecting cash from customers.
Days Sales Outstanding (DSO) hit 182 days in Q4 2025 — customers owe CoreWeave more than two full quarters of revenue.
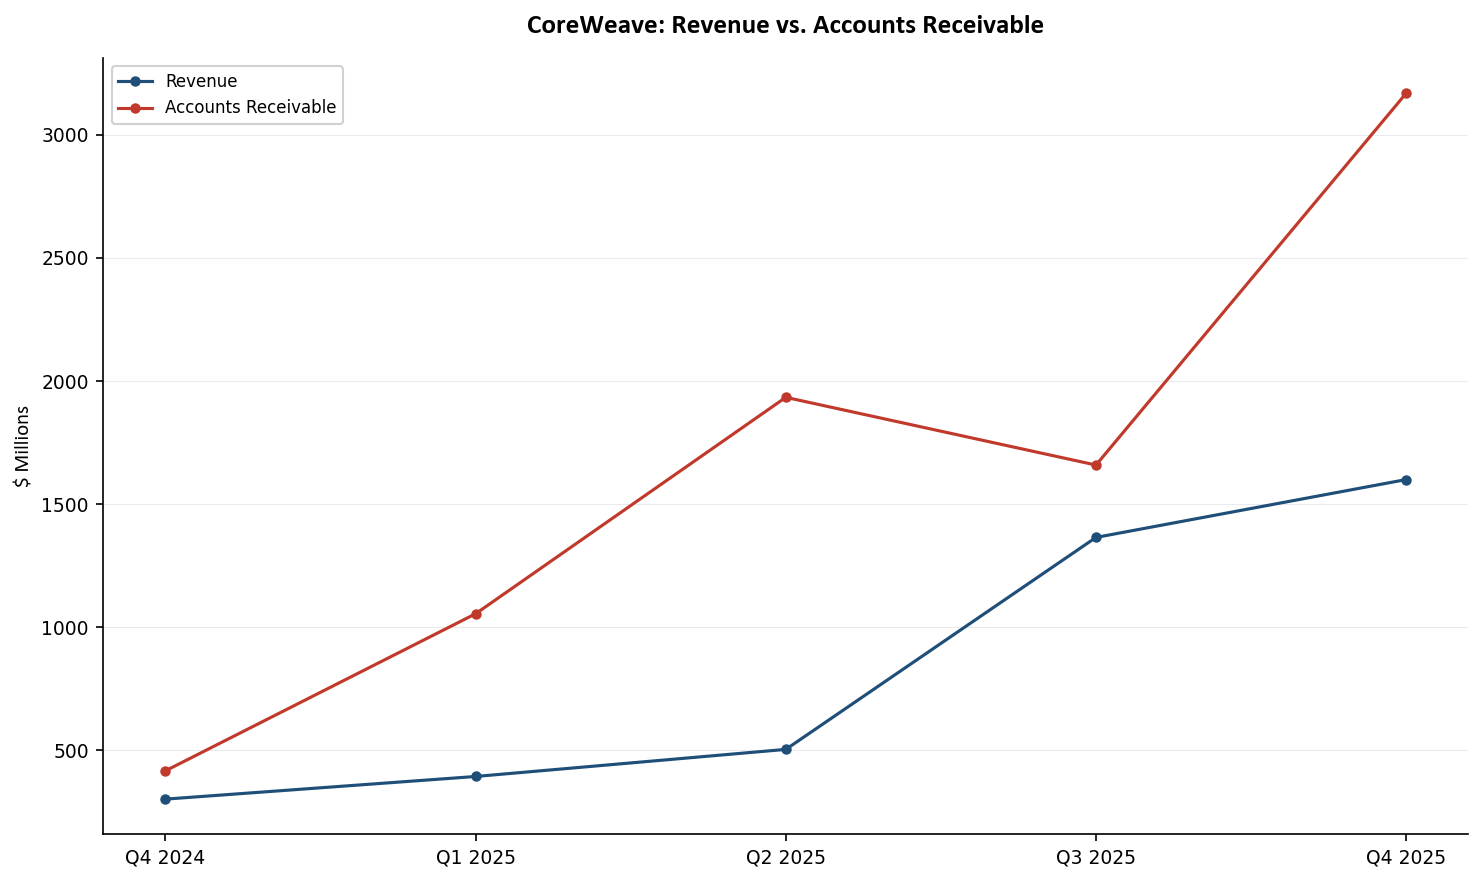
In Q4, accounts receivable grew 7.3x faster than revenue — for every $1 of new revenue, $7.30 went unpaid. Revenue recognition is outpacing cash collection by approximately six months.
Pause on this. CoreWeave is providing vendor financing — effectively extending credit — to some of the richest companies on the planet. Microsoft generated $81.3B in revenue last quarter.2 It is not short of cash. The question is not whether Microsoft can pay, but whether the contractual payment terms and deployment verification processes create a structural lag between when CoreWeave records revenue and when cash arrives.
If DSO stays above 150 days through Q1 2026, this is structural, not a timing artifact. And a company servicing $21.4B in debt cannot afford to fund six months of float for its customers indefinitely.
VI. THE HOCKEY STICK PROBLEM
The carrying costs, the CIP buildup, the DSO expansion — all of these are survivable if revenue accelerates fast enough to close the gap. CoreWeave’s FY2026 guidance says it will. The math says that’s an extraordinary claim.
| Metric | Value |
|---|---|
| FY2025 Revenue | ~$5.1B |
| FY2026 Guide (midpoint) | $12.5B |
| Required YoY Growth | ~145% |
| Q1 2026 Guide (midpoint) | $1.95B |
| Remaining Q2-Q4 Revenue Needed | $10.55B ($3.5B/quarter avg) |
| Best Quarter Ever (Q4 2025) | $1.572B |
They have never done $2B in a quarter. The guidance requires doing $3.5B — nearly 70% of what they made in all of FY2025 — every quarter for three quarters in a row, starting Q2.
Sequential growth has been decelerating:
| Quarter | Revenue | Sequential Growth |
|---|---|---|
| Q2 2025 | $1,127M | +81% |
| Q3 2025 | $1,365M | +21% |
| Q4 2025 | $1,572M | +15% |
| Quarter | Revenue (Projected) | Sequential Growth |
|---|---|---|
| Q1 2026E | $1,950M | +24% |
| Q2-Q4 2026E (needed) | ~$3,500M avg | +80% from Q1 |
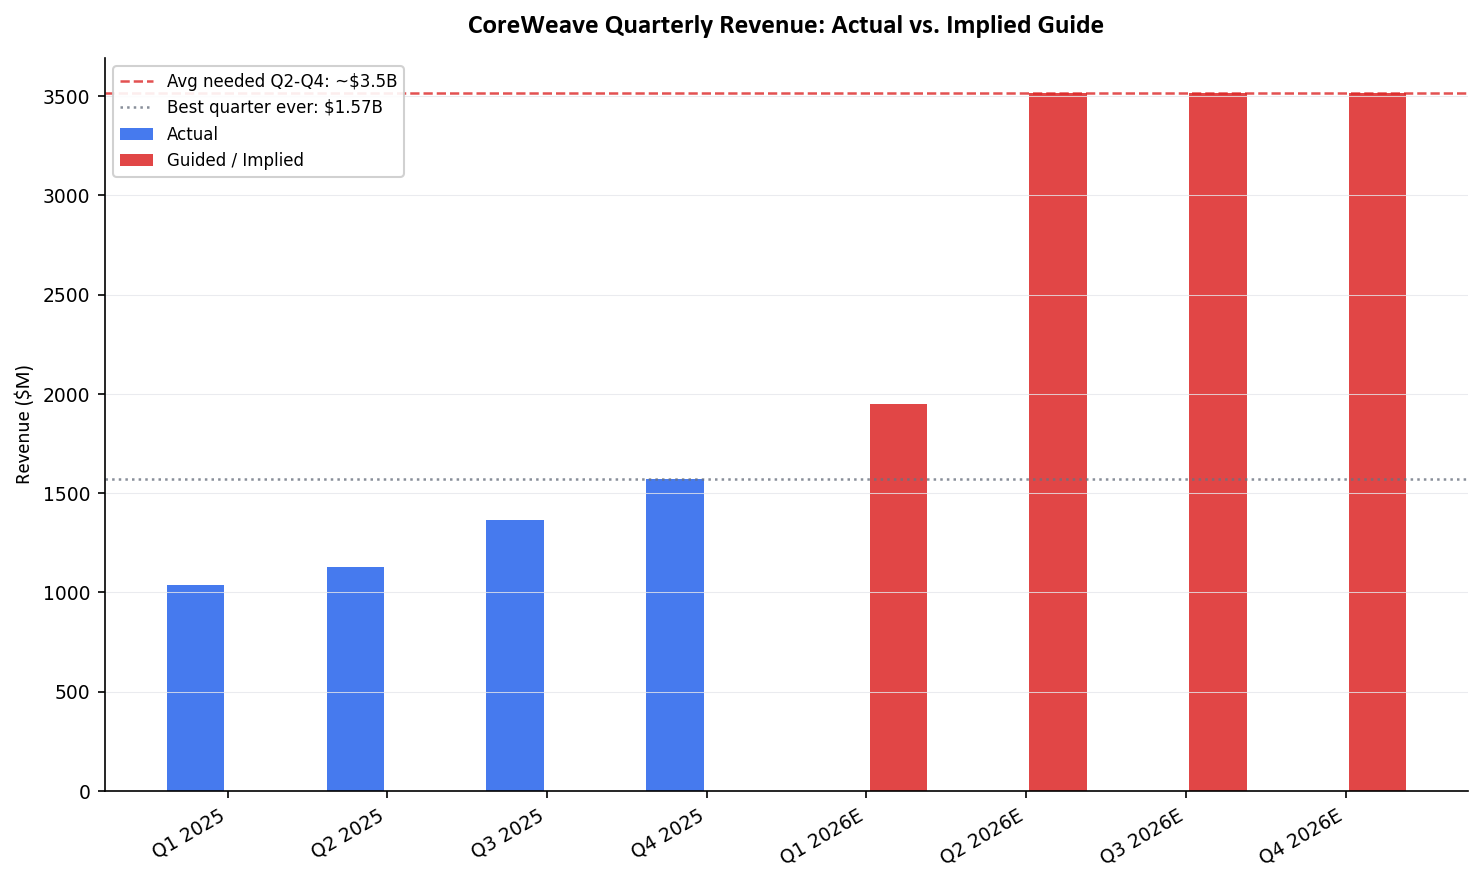
The guidance requires a violent re-acceleration from a decelerating trend. Q1 at $1.95B is itself only +24% sequential — the ramp needs to more than triple to hit the back half of the year.
The bulls will say the backlog supports it — $66.8B in contracted revenue, with 42% expected to be recognized within 24 months. The backlog is real. But backlog conversion requires deployed capacity, and deployed capacity requires the physical conversion pipeline to run at a pace CoreWeave has never demonstrated. Every quarter of the hockey stick depends on the CIP pile converting to active infrastructure on schedule. If deployment runs two months behind plan — a rounding error in data center construction — the hockey stick flattens and the FY2026 guide is dead.
VII. THE INTEREST COVERAGE SQUEEZE
The financial pressure is visible in the simplest credit metric: can CoreWeave’s earnings cover its interest payments?
| Period | Interest Expense | Revenue | Adj. EBITDA | EBITDA/Interest |
|---|---|---|---|---|
| Q4 2025 | $388M | $1,572M | $898M | 2.3x |
| Q1 2026 (guided) | $510-590M | $1,900-2,000M | ~$850M est. | ~1.5x |
Q1 2026 is the trough — management confirmed this on the Q4 call, stating that margins will expand quarterly from Q1, returning to low-double digits by Q4. Interest expense jumps because the massive debt drawdowns to fund $8.2B in Q4 capex and $6-7B in Q1 capex are now accruing full quarters of interest. Revenue has not caught up yet because the deployed capacity is still ramping.
At 1.5x EBITDA-to-interest coverage, CoreWeave is operating with virtually no margin for error. For context, investment-grade corporate debt typically requires 3x+ coverage. High-yield issuers generally maintain 2x+. Below 1.5x, a single quarter of execution miss — a deployment delay, a customer renegotiation, a power grid constraint — can push coverage below 1x, meaning the company cannot cover its interest from operations.
Mitigating factor: Management states that no debt maturities arrive until 2029, and the delayed-draw credit facilities only fund capital as data centers come online, partially aligning cash outlays with deployment. This is real and it matters — CoreWeave is not facing a near-term maturity wall. But it does not change the interest coverage arithmetic. The debt is outstanding. The interest accrues. And the revenue must arrive on schedule to service it.
VIII. CAPEX EFFICIENCY IS DECLINING
If the conversion gap were simply a timing issue — temporary friction that resolves as deployment catches up — you would expect each dollar of capex to produce at least the same incremental revenue over time, if not more as the company scales. The opposite is happening.
| Period | Capex | Incremental Revenue | Revenue per $1 Capex |
|---|---|---|---|
| FY2025 (Q1-Q3) | $10.3B | +$3.2B (FY2025 vs FY2024) | $0.31 |
| FY2026E | $30.0B+ | +$7.4B | $0.25 |
Full FY2025 capex reached $14.9B with Q4’s massive $8.2B deployment — hardware that will generate revenue in FY2026, not FY2025. Even giving that timing lag the benefit of the doubt, each dollar of guided FY2026 capex produces 19% less incremental revenue than the prior cohort. Revenue per megawatt of active power capacity dropped roughly 20% quarter-over-quarter from Q3 to Q4 2025. New capacity is not monetizing at the same rate as the existing base.
There are benign explanations: FY2026 capex is heavily front-loaded, meaning the revenue from those GPUs arrives in FY2027 and beyond. Next-generation hardware (Blackwell, then whatever follows) may command higher pricing per unit of compute. And the sheer scale of the buildout introduces construction and deployment delays that compress near-term returns but do not impair long-term economics.
But there is also a less benign reading — one supported by an industry-wide shift that is already underway.
IX. THE INFERENCE SHIFT: A STRUCTURAL HEADWIND
The declining capex efficiency described above might be temporary if the AI compute market were static. It is not. The industry is undergoing a fundamental transition from training-dominated workloads to inference-dominated workloads — and inference economics are structurally different from training economics in ways that threaten CoreWeave’s entire business model.
The Shift Is Already Happening
The data is unambiguous. According to Deloitte’s 2026 TMT Predictions, inference accounted for roughly one-third of all AI compute in 2023, approximately one-half in 2025, and is projected to reach two-thirds by 2026. A Menlo Ventures survey of 150 technical decision-makers (mid-2025) found that 74% of builders say the majority of their workloads are now inference — up from 48% just one year earlier.
The hyperscalers are saying it publicly. Satya Nadella told investors in October 2024 that Microsoft’s AI business is “going to be the fastest growth to $10 billion of any business in our history — it’s all inference.” Andy Jassy stated on Amazon’s Q4 FY2025 call that “the majority of the long-term AI workloads is going to be inference.” Google unveiled Ironwood — its seventh-generation TPU — explicitly branded as “the first TPU for the age of inference.” Even Jensen Huang, whose company sells the GPUs CoreWeave is buying, reframed NVIDIA’s entire value proposition around inference on the Q4 FY2026 call: “Inference is revenues.”
Why This Matters: Inference Can Be Optimized. Training Cannot.
Training a frontier AI model is computationally rigid. It requires thousands of GPUs running in tight synchronization for weeks or months, at full precision (FP16/BF16), with no meaningful shortcuts. You cannot train half a model. You cannot quantize the training process. The compute bill is what it is.
Inference is different. Every major optimization technique in AI compute applies disproportionately — or exclusively — to inference:
- Quantization: Inference can run at INT8 or INT4 precision with minimal quality loss, cutting compute requirements by
2-4x. Training requires full precision. - Distillation: Smaller, cheaper models can serve inference workloads that previously required frontier models. You cannot distill a training run.
- Speculative decoding, KV cache optimization, batching: Software-level optimizations that reduce inference cost per token by
30-50%. None apply to training. - Purpose-built inference hardware: Google’s Ironwood TPU, Amazon’s Inferentia, Meta’s MTIA — custom silicon designed specifically for inference at a fraction of the cost per token of NVIDIA’s general-purpose GPUs.
The result: inference cost per token is falling at approximately 10x per year, according to Epoch AI’s tracking data — and accelerating. NVIDIA’s own Grace Blackwell platform delivers what Jensen Huang called “an order-of-magnitude lower cost per token” versus prior generation hardware.
What This Means for CoreWeave
CoreWeave’s fleet is NVIDIA GPUs — H100s, H200s, and now Blackwell — priced and contracted at rates that assume training-tier demand and training-tier pricing. The company’s $66.8B backlog and $30B+ FY2026 capex plan are predicated on sustained demand for general-purpose GPU compute at current contract rates.
But if the majority of AI compute demand is shifting to inference, and inference costs are compressing 10x per year through optimization, the pricing power of a general-purpose GPU fleet erodes structurally. The hyperscalers — CoreWeave’s customers — are not sitting idle. Microsoft, Google, Amazon, and Meta are all building or deploying inference-specific hardware that they own and operate. They do not need to rent CoreWeave’s GPUs for inference workloads that can run cheaper on their own silicon.
This does not mean CoreWeave’s GPUs become worthless overnight. Training demand persists. But it means the marginal GPU in CoreWeave’s fleet — the one funded by the next billion dollars of debt — faces a market where the dominant workload is shifting toward hardware and pricing models that CoreWeave does not control. The $30B in FY2026 capex is not just buying depreciating assets. It is buying depreciating assets into a market where the per-unit economics are compressing faster than the assets depreciate.
X. THE DAISY CHAIN
CoreWeave does not exist in isolation. It sits at the center of a web of mutual financial obligations where every participant depends on every other participant continuing to perform.
| Who Owes Whom | Amount |
|---|---|
| Customers owe CoreWeave (AR) | $3,169M |
| Customers prepaid CoreWeave (deferred revenue) | $8,185M |
| CoreWeave owes suppliers (AP + accrued) | $7,396M |
| CoreWeave owes lenders (current debt, <12 months) | $6,708M |
| CoreWeave owes lenders (total debt) | $21,373M |
| Net working capital | -$8,952M |
This structure works only if all four groups — customers, suppliers, lenders, and prepayers — continue cooperating simultaneously. Customers must keep paying (even at 182-day lag). Suppliers must keep shipping hardware on credit. Lenders must keep extending new facilities. And the $8.2B in deferred revenue — cash collected for services not yet delivered — must convert into delivered compute before customers invoke contractual protections.
The $8.5B Meta-backed credit facility — which was supposed to be the bull case’s answer to every liquidity question — was conspicuously absent from the Q4 2025 earnings discussion. Instead, CoreWeave issued $2.6B in convertible senior notes. The Meta facility may yet close. But its absence from the most recent capital raise is a data point worth monitoring.
XI. SUPPLY CHAIN FRAGILITY
The financial pressures described above exist under ideal operating conditions — where GPUs ship on time, data centers are built on schedule, and power is available when needed. The real world introduces friction at every point.
| Disruption | Direct Impact | Financial Impact on CRWV |
|---|---|---|
| TSMC production delay | NVIDIA can’t ship GPUs | CIP grows, no new revenue |
| Shipping disruption | GPUs in transit | Carrying cost, zero revenue |
| Power grid constraint | GPUs delivered, no power | Hardware in warehouse |
| Datacenter construction delay | Shells not ready | CIP grows |
| Customer pullback (MSFT) | Demand shock | 67% concentration = existential |
A three-month supply chain disruption on $10B of GPU orders produces approximately $750M in incremental carrying costs — interest and depreciation accruing on hardware that cannot generate revenue.
CoreWeave acknowledged this risk in its own earnings calls. Management noted on the Q4 call that they “quickly cleared the delays discussed in our third quarter earnings call” related to datacenter delivery. The fact that delivery delays were material enough to discuss on the Q3 call, and that resolving them warranted mention in Q4, tells you how tight the tolerances are. This is a system operating at the edge of its conversion capacity, where a few weeks of slippage at any point cascades into millions in unplanned carrying costs.
XII. THE MARKET ALREADY KNOWS SOMETHING IS WRONG
CoreWeave has reported three quarters as a public company. The market has sold the stock after every single one.
| Earnings Date | Post-Earnings Move |
|---|---|
| Q2 2025 (Aug 12) | -16% |
| Q3 2025 (Nov 10) | -21% |
| Q4 2025 (Feb 26) | -8% (after hours) |
Three consecutive post-earnings selloffs. The pattern is consistent: analysts anchor to the backlog story, set expectations accordingly, and the income statement disappoints. Q4 EPS missed by 130% — actual -$1.04 versus consensus -$0.45. The revenue growth is impressive in isolation. But the cost structure — interest, depreciation, SBC, operating losses — overwhelms it every quarter.
This is not a broken company reporting bad numbers. This is a company reporting exactly the numbers you would expect from a leveraged time arbitrage where the conversion gap is wider than the market assumed. Revenue grows. But the costs of funding the growth grow faster.
XIII. THE TRADE
We are short CRWV via a September 2026 bear put spread. Target: $45-80. Current price: approximately $90 (post-Q4 earnings, after hours).
The Catalyst Path
Mid-May 2026: Q1 2026 Earnings. Does the hockey stick start? The guide is $1.95B. What matters more: DSO trajectory (does it normalize below 150 or stay elevated?), CIP level (does it stay below $11B or blow past $13B?), and capex efficiency (does each dollar produce more or less incremental capacity?).
Mid-August 2026: Q2 2026 Earnings. This is the decisive quarter. If Q2 revenue does not show $3B+, the FY2026 guide of $12-13B is mathematically dead. The back half would need to average $4B+ per quarter — a number that strains credulity. September expiry gives approximately ten days of cushion after Q2 earnings for the repricing to play out.
What to Watch
The single most important number at Q1 2026 earnings is Construction in Progress.
| Scenario | CIP at Q1 2026 | What It Means |
|---|---|---|
| Healthy | $9-11B | Deployment keeping pace with $6-7B in Q1 capex. New capacity placed in service roughly as fast as it’s procured. The time arbitrage is working. |
| Warning | $12-15B | Pipeline backing up. Hardware purchased faster than deployed. Interest accruing on dead weight. Margin trough extends beyond Q1. |
| Critical | >$15B | System breaking. CIP would represent >35-40% of total PP&E. Revenue guidance for Q2/Q3 at risk. |
The math: Q1 capex of $6-7B flows into CIP. Simultaneously, some CIP converts to in-service PP&E as new capacity comes online. If CoreWeave adds ~200-260 MW in Q1 (consistent with Q4’s deployment pace), that represents roughly $3-5B moving from CIP to active. Net CIP should be roughly flat to up $2-3B if deployment keeps pace. Above $13B means the system is falling behind.
Supporting Metrics
| Metric | Q4 2025 Baseline | Healthy Q1 2026 | Warning |
|---|---|---|---|
| Revenue | $1,572M | $1,900-2,000M (guided) | <$1,850M |
| Adj. Operating Income | $88M | $0-40M (guided trough) | Negative |
| Interest Expense | $388M | $510-590M (guided) | >$600M |
| Active Power (MW) | 850 MW | ~1,000-1,100 MW | <950 MW |
| Revenue Backlog | $66.8B | Stable or growing | Declining |
| DSO | 182 days | <150 days | >150 days |
| Customer Concentration | ~67% (MSFT) | Declining toward 50-55% | Increasing |
The Big Picture Test
Revenue per MW of Active Power — the simplest measure of whether deployed capacity is earning its keep:
- Q4 2025:
$1,572M/850 MW=$1.85M/MW/quarter - If Q1 2026:
$1,950M/1,050 MW=$1.86M/MW → Healthy (productivity maintained) - If Q1 2026:
$1,900M/1,100 MW=$1.73M/MW → Warning (utilization declining) - If Q1 2026:
$2,000M/950 MW=$2.11M/MW → Bullish (pricing power + high utilization)
Revenue per MW tells you whether the time arbitrage is working. Flat or rising means deployed GPUs are earning their keep. Declining means capacity is being added faster than it can be monetized — the conversion gap is widening, and the carrying costs are winning.
XIV. WHAT COULD PROVE US WRONG
The hockey stick materializes. Management stated on the Q4 call that they are “virtually sold out in 2026” and that “substantially all” of the FY2026 capex is tied to already-signed customer contracts. If Q1 revenue comes in at $2.2B+ with DSO below 120 days and CIP declining, the conversion gap is closing and the thesis is wrong. Close the position.
The Meta loan closes on favorable terms. The $8.5B facility would dramatically improve the liquidity narrative. It would not fix the DSO or capex efficiency trends, but it would extend the runway and shift market sentiment. This is the single biggest risk to the trade.
GPU pricing power increases. If the next generation of hardware (Blackwell Ultra, Rubin) commands meaningfully higher per-unit pricing, CoreWeave’s revenue per MW could jump even as deployment pace stays constant. This would close the conversion gap from the revenue side.
A strategic acquirer. Microsoft or another hyperscaler could acquire CoreWeave, taking out the equity at a premium. The probability is low given the $50B+ market cap and $21B in debt, but it is not zero.
AI demand inflects higher than anyone expects. If a breakthrough application creates a step-function increase in compute demand — something beyond current training and inference workloads — every GPU in CoreWeave’s fleet becomes more valuable, utilization rises, and pricing power strengthens. We are not betting against AI demand. We are betting that the financial structure cannot keep pace with the physical deployment required to serve it.
XV. THE BOTTOM LINE
The AI infrastructure buildout is real. The demand for compute is real. The contracts are real. But between the contract and the running GPU sits a conversion gap — a physical, irreducible period of time during which data centers must be built, hardware must be shipped and racked, power must be connected, and workloads must be onboarded. And across that gap, the financial obligations — interest, depreciation, carrying costs — do not pause.
CoreWeave sits at the most leveraged point in the chain, absorbing the deployment risk that Microsoft and NVIDIA have structured away. It is doing exactly what the market is asking: converting financial demand into physical infrastructure at unprecedented speed. The question is not whether the demand justifies the buildout. The question is whether the buildout can proceed fast enough to service the debt that funds it.
Construction in Progress at Q1 2026 is the number that answers that question. Keep it at $11B or below and the system holds — the gears are turning, GPUs are deploying, revenue is ramping, and the time arbitrage works. Let it blow past $15B and the financial scaffolding starts to wobble — hardware stacking up faster than it can be deployed, carrying costs compounding, and the hockey stick revenue trajectory the market is pricing quietly becoming impossible.
CoreWeave is not the villain. It is the canary. And the canary is singing.
APPENDIX: DATA SOURCES
SEC Filings
- CoreWeave (CRWV): 10-Q filings (Q1-Q3 2025), S-1/A (March 2025), Q4 2025 earnings release (February 26, 2026). All balance sheet, income statement, and cash flow data sourced from SEC EDGAR.
- NVIDIA (NVDA): 10-Q and 10-K filings (FY2025-FY2026). Data center revenue segment, inventory, accounts receivable, and purchase obligations from quarterly SEC filings.
- Microsoft (MSFT): 10-Q and 10-K filings (FY2024-FY2025). Finance lease obligations, Remaining Performance Obligations, property plant and equipment, and operating cash flow from quarterly SEC filings.
Earnings Calls & Guidance
- CoreWeave Q4 2025 earnings call (February 26, 2026): FY2026 revenue guidance of
$12-13B, Q1 2026 guidance of$1.9-2.0B, Q1 adjusted operating income guidance of$0-40M, Q1 interest expense guidance of$510-590M, FY2026 capex guidance of “at least$30B.” Management stated FY2026 capacity “virtually sold out,” FY2026 capex tied to already-signed contracts, and target of1.7 GWactive power by year-end 2026. - NVIDIA Q4 FY2026 earnings (February 25, 2026):
$68.1Btotal revenue; data center segment approximately90%of total. FY2026 annual revenue:$215.9B, up 65% YoY.
Disclosure: We are short CRWV via a September 2026 bear put spread. We have no position in NVDA, MSFT, or TSM. This is not investment advice. All data is from public SEC filings and earnings disclosures. Do your own work.
CoreWeave, Inc. SEC filings and earnings releases. All balance sheet data (debt, AR, CIP, deferred revenue, working capital), income statement data (revenue, interest expense, operating income), and cash flow data (capex, capital expenditures incurred but not yet paid) from 10-Q filings (Q1-Q3 2025) and Q4 2025 earnings release. Revenue backlog (RPO) from quarterly disclosures:
$14.7B(Q1 2025),$30.1B(Q2 2025),$50.0B(Q3 2025),$66.8B(Q4 2025). Customer concentration from revenue disaggregation disclosures. ↩︎ ↩︎ ↩︎Microsoft Corporation SEC filings. Finance lease liabilities from quarterly balance sheets:
$22.9B(Q1 2024) to$60.2B(Q4 2025). Remaining Performance Obligations disclosed in quarterly 10-Q filings. Operating cash flow from quarterly cash flow statements. Revenue from quarterly income statements. ↩︎ ↩︎NVIDIA Corporation 10-K (FY2026, filed for fiscal year ending January 25, 2026). FY2026 total revenue:
$215.9B, up 65% YoY. Data Center segment comprised approximately 90% of total revenue. FY2026 quarterly total revenue: Q1$44.1B, Q2$46.7B, Q3$57.0B, Q4$68.1B. Inventory, accounts receivable, and purchase obligations from quarterly balance sheets. Cumulative data center revenue estimated from segment disclosures beginning Q2 FY2024 (May 2023). ↩︎ ↩︎NVIDIA Corporation purchase obligations disclosed in 10-Q commitment and contingency footnotes.
$45.8Bas of Q2 FY2026 (July 2025). Q3 FY2026 purchase obligations not yet disclosed in quarterly filing at time of publication. ↩︎